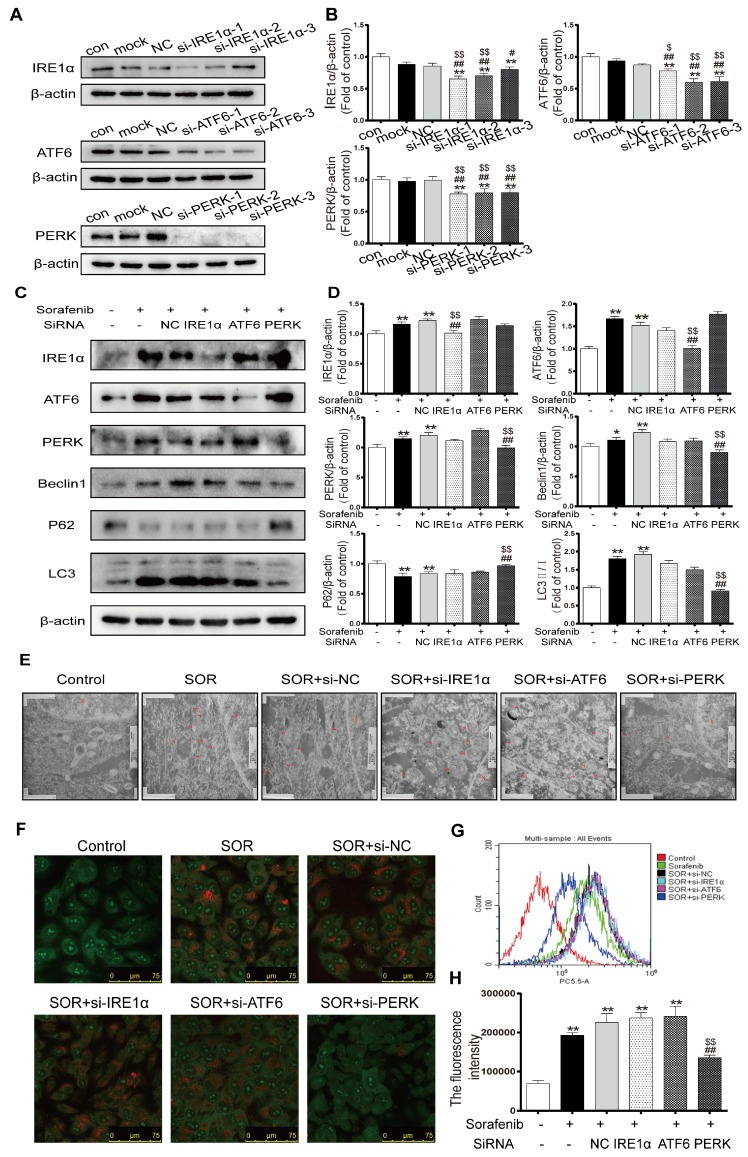
Figure 6.
Sorafenib-induced ER stress triggers autophagy through the PERK pathway. (A, B) Western blot analysis of the most effective sequences to silence the UPR pathway. **P < 0.01 compared to control; ##P < 0.01, #P < 0.05 compared to mock; $P < 0.05, $$P < 0.01 compared to NC. (n = 3). (C, D) Western blot analysis of IRE-1, ATF-6, PERK, P62, Beclin1 and LC3 expression after the three UPR pathways were knocked down in sorafenib-treated cells. (E) Autolysosomes were observed by transmission electron microscopy. (F) Acridine orange images were taken after the UPR pathway was knocked down in sorafenib-treated cells. (G) AVO quantification by flow cytometry analysis. (H) Mean orange fluorescence intensity. **P < 0.01 compared to control; ##P < 0.01 compared to sorafenib; $$P < 0.01 compared to NC. (n = 3).

