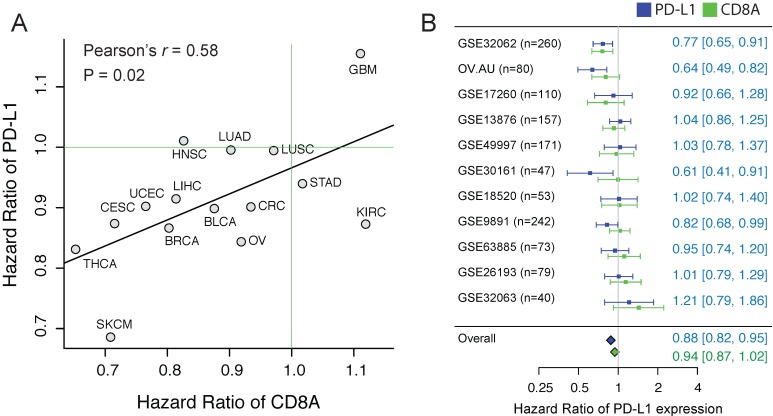
Figure 1.
The correlation of the prognostic values between CD8A and PD-L1. (A) Scatter plot of hazard ratios of PD-L1 and CD8A across different cancers. (B) Forest plot visualizing the hazard ratios of univariate Cox proportional regression analyses of CD8A and PD-L1 expression in 11 independent ovarian cancer cohorts. The diamonds shows the fixed-effects meta-analysis summary of hazard ratios over 11 cohorts.

