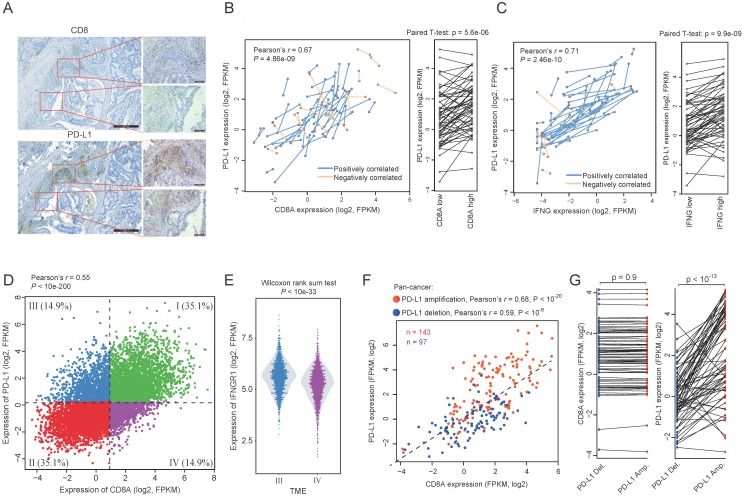
Figure 3.
Regulatory events of the association between PD-L1 expression and CD8A. (A) A representative IHC staining of colon tumor sample showing the intratumoral correlation between CD8 and PD-L1. (B) Correlation between PD-L1 expression and CD8A expression across tumor samples. Samples from different portions of the same tumor are connected by lines. Blue lines indicate the sample pairs where high CD8A expression is associated with high PD-L1 expression, whereas orange lines indicate the sample pairs where high CD8A expression is associated with low PD-L1 expression. Right panel shows a pairwise comparison of samples from different portions of the same tumor. (C) Same as (B) but shown for the correlation between the expression of PD-L1 and IFN-γ. (D) Scatter plot of the expression of PD-L1 and CD8A across pan-cancer tumors. TME I-IV are shown by different colors. (E) Violin plots of IFNGR1 expression for TME-III tumors and TME-IV tumors. (F) Scatter plot of the expression of PD-L1 and CD8A according to PD-L1 amplification (red) or deletion (blue). (G) Pairwise comparison of the expression of CD8A and PD-L1 between tumors with extremely similar expression of CD8A but different copy number status of PD-L1.

