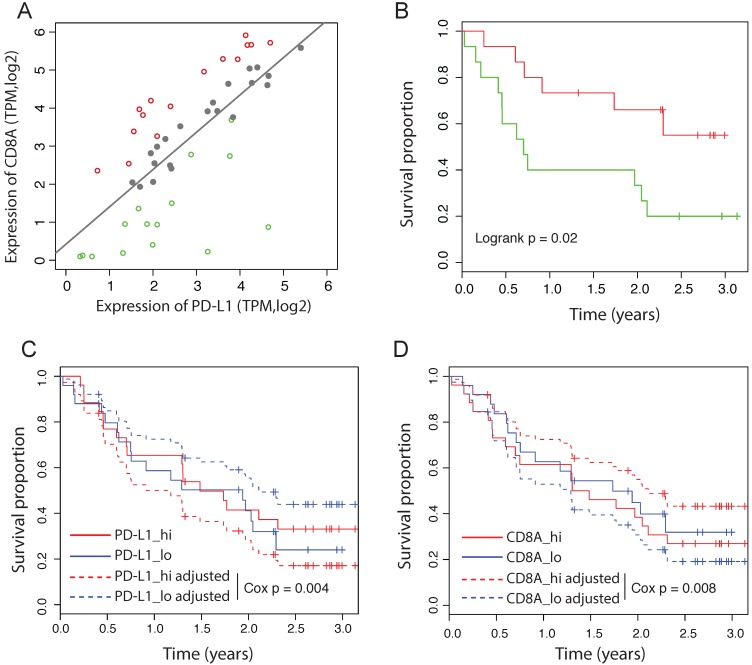
Figure 4.
Independent prognostic values of PD-L1 in immunotherapy dataset. (A) Correlation between the expression of CD8A and PD-L1 in melanoma patients treated by nivolumab. Dashed line represents linear regression model. Patients are divided into the high efficient reactive group (red), the expected reactive group (grey) and the high efficient reactive group (green). (B) Survival curves of melanoma patients between the low and high efficient reactive group. (C) Survival curves of PD-L1 before and after adjusted for CD8A expession in melanoma received nivolumab. Adjusted survival curves are generated by multivariate Cox_PH model. Patients are divided by the median value. (D) Survival curves of CD8A before and after adjusted for PD-L1 expression in melanoma received nivolumab.

