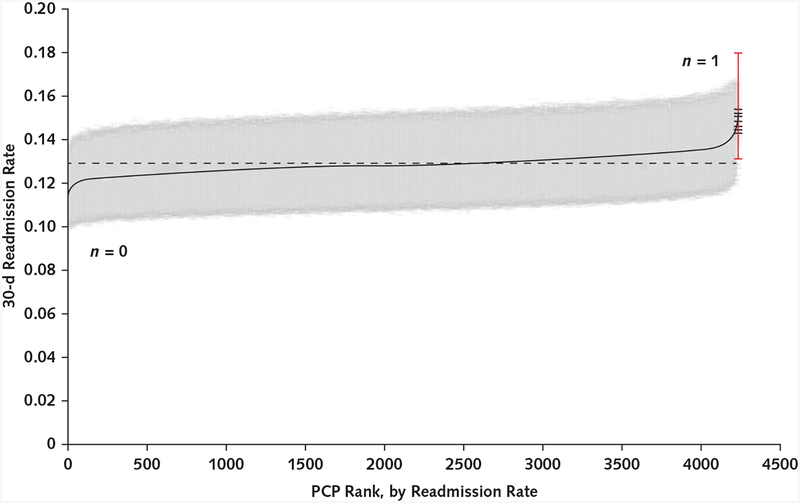
Figure 1.
Variation among 4230 PCPs in 30-day risk-standardized readmission rates.
Readmission rate estimates were generated with a method used by the Centers for Medicare & Medicaid Services, which generates the ratio of the predicted to expected number of readmissions, multiplied by the national unadjusted rate, with bootstrapping (18). The readmission rates (adjusted means and 95% CIs) for each PCP are ranked from lowest to highest. The adjusted mean rate was 12.9% (dashed line). The minimum and maximum adjusted rates were 11.2% and 15.3%, respectively. The 10th percentile was 12.4% and the 90th was 13.4%, each only 0.5 percentage point from the mean. The 99th percentile rate was 14.0%, 1.1 percentage points above the mean. Only 1 PCP had a significantly higher readmission rate, indicated in red, and no PCP had a significantly lower rate. PCP = primary care physician.

