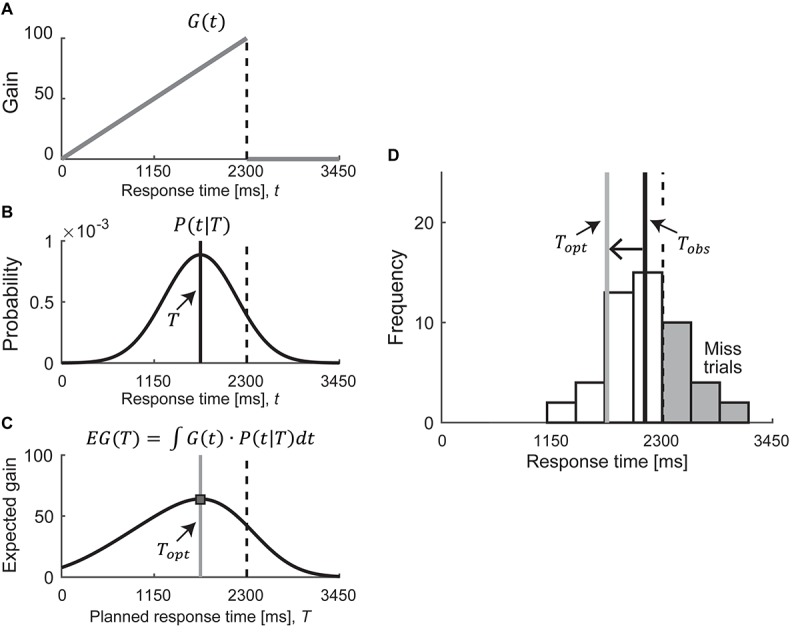
FIGURE 2.

Model assumptions. (A–C) Calculation of the optimal mean response time in asymmetric condition. We modeled the optimal mean response time as . The expected gain can be calculated by integrating the gain function G(t) with the probability distribution of response time P(t|T), as a function of the planned response time T. The optimal mean response time (shown as a gray solid line) is defined as the response time that maximizes the expected gain. (D) Example of response histogram for risk-seeking strategy in asymmetric condition. In this example, the observed mean response time (shown as a black solid line) is slower than the optimal mean response time (shown as a gray solid line), which leads to too many mistrials (shown in the gray bars). Therefore, this strategy is classified as risk-seeking. A one-way left arrow shows the difference between Tobs and Topt. We defined this difference as the risk-attitude.
