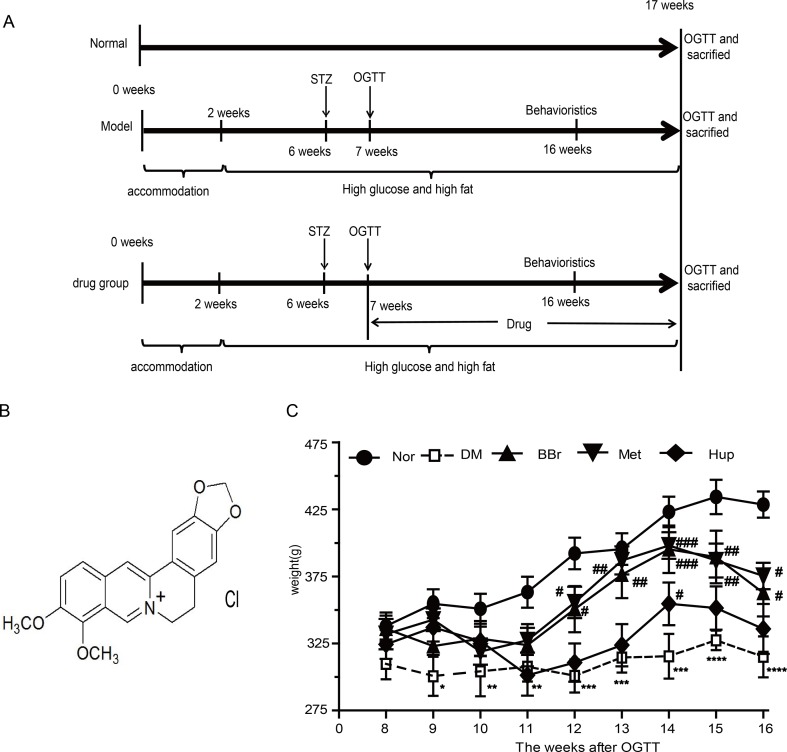
Figure 1.
Flow chart of animal experiment design and body weight variation. (A) A total of 100 male Wistar rats fed with HSFD diet were assigned to DM model groups, whereas 20 rats fed by standard chow were assigned to control group. After 2 weeks adaptive feeding, DM model group was given HSFD feeding for 4 weeks. Then, 25 mg/kg STZ was injected into caudal vein to form the diabetes animal model in HSFD group, whereas normal group were injected with citrate buffer only. Behavioral evaluation was performed after feeding for 16 weeks. In the 16th week, all rats were sacrificed from which we collected samples and executed follow-up experiment. (B) Molecular formula of berberine. (C) Body weight variation. *P < 0.05 vs. Nor; **P < 0.01 vs. Nor; ***P < 0.001 vs. Nor; ****P < 0.0001 vs. Nor; # P < 0.05 vs. DM; ## P < 0.01 vs. DM; ### P < 0.01 vs. DM.

