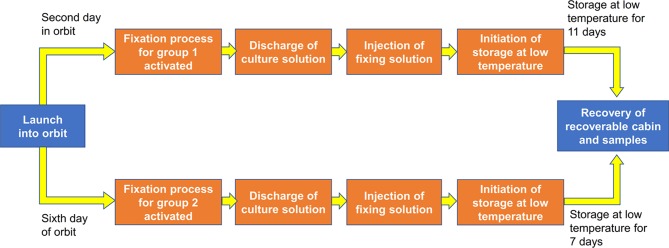
Figure 2.
Flow chart of the experiment. We seeded 1 × 10⁶ wild-type mESCs for 1 day of culture (cell culture device A), 2 × 10⁵ wild-type mESCs for 5 days of culture (cell culture device B), 1 × 10⁶mRad9-/- mESCs for 1 day of culture (cell culture device C) and 4 × 10⁵ mRad9 −/− mESCs for 5 days of culture (cell culture device D). The four cell culture devices were divided into two groups, with cell culture devices A and C in group 1 and cell culture devices B and D in group 2.

