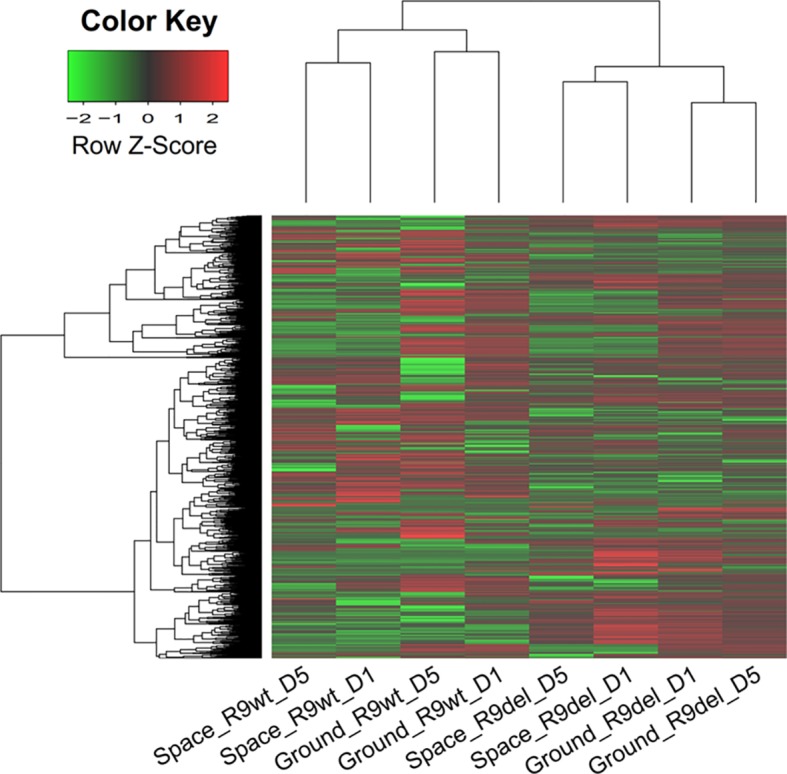
Figure 3.

Hierarchical clustering of the expression of all DEGs (identified with a single-sample comparison strategy) in eight mESC samples. Each row represents a gene, while each column represents a sample. The expression intensities range from green (low expression) to red (high expression). The dendrograms at the top and left of the heat map suggest the similarities among the samples and genes, respectively. Space, mESCs cultured in space; Ground, mESCs cultured on the ground; R9wt, wild-type mESCs; R9del, Rad9 −/− mESCs; D5, mESCs cultured for 5 days; D1, mESCs cultured for 1 day.
