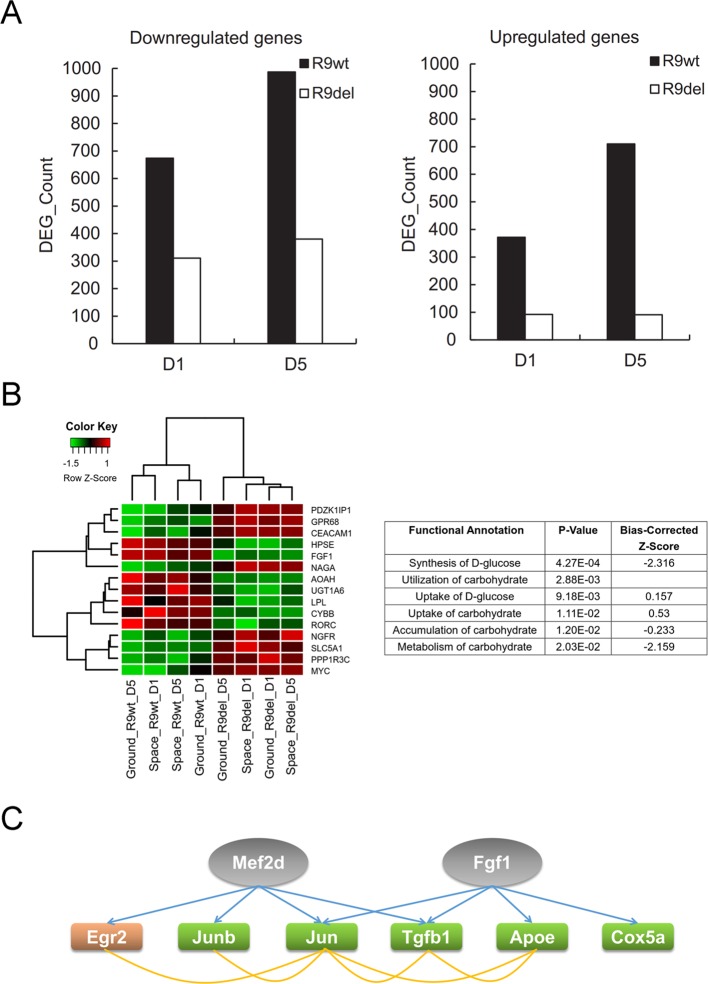
Figure 7.
Rad9 deletion weakens the spaceflight-induced gene expression response in mESCs. (A) Comparison of the numbers of DEGs influenced by spaceflight in wild-type (R9wt) mESCs and Rad9 −/− (R9del) mESCs after both 1 day (D1) and 5 days (D5) of culture. There were fewer downregulated genes (left) and upregulated genes (right) in Rad9 −/− mESCs than in wild-type mESCs. (B) Carbohydrate metabolism was affected by Rad9 deletion according to IPA analysis. Listed are the carbohydrate metabolism-related terms enriched for Rad9 deletion-influenced DEGs. A negative z-score value indicates downregulation (right). The expression of the DEGs involved in carbohydrate metabolism is presented in the heat map (left). (C) Two DEGs (Mef2d and Fgf1, labelled in grey) influenced by Rad9 deletion can also regulate the expression of six of the DEGs (labelled with orange or green) influenced by spaceflight. Regulating of one gene towards another gene is shown using blue arrow, while associations (either interaction or co-expression or co-localization) between two genes are shown using yellow lines. Orange-labelled genes, genes upregulated by spaceflight; green-labelled genes, genes downregulated by spaceflight; grey-labelled genes, IPA-predicted upstream factors of the orange- and green-labelled genes.

