FIGURE 2:
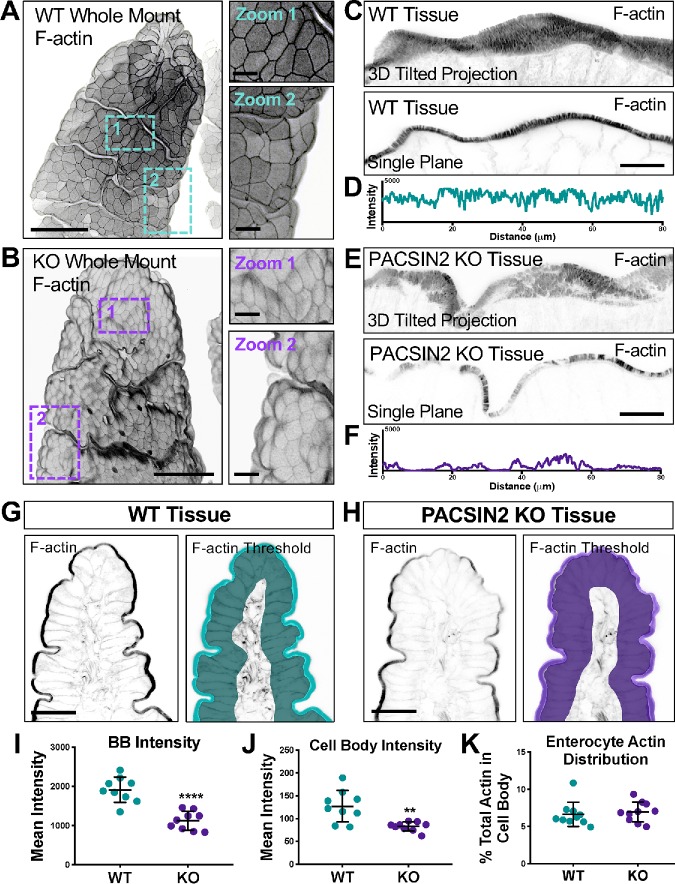
Loss of PACSIN2 decreases apical and basolateral F-actin levels. (A, B) Three-dimensional projections of 50-μm sections of WT (A) and PACSIN2 KO (B) whole mount tissue. Zooms highlight differences in cell surface morphology and actin intensity between WT and KO. Actin signal is inverted to simplify visualization; scale bars, 50 μm for main panels, 10 μm for zooms. (C, E) Three-dimensional reconstructed volumes of 8-μm sections, top, and single image planes, bottom, of phalloidin-stained WT and PASCIN2 KO frozen tissue sections. Scale bars, 25 μm. (D, F) Plots of raw 8-bit intensity data from an 80-μm line drawn through the brush border of the single plane images. PACSIN2 KO tissue has ∼twofold decrease in brush border actin intensity. (G, H) Phalloidin labeling of WT and PACSIN2 KO frozen tissue sections. Right panels show representative thresholding of brush border and cell body used in quantification (I–K). Scale bars, 50 μm. (I) Quantification of brush border (BB) actin intensity between WT and PACSIN2 KO tissue; nine tissue sections per condition. (J) Quantification of cell body actin intensity between the WT and PACSIN2 KO tissue; nine tissue sections per condition. (K) Quantification of actin in the cell body as a percentage of total actin between WT and PACSIN2 KO; nine tissue sections per condition. Error bars indicate ± SD; p values were calculated using a t test (**p < 0.01, ****p < 0.0001).

