FIGURE 4:
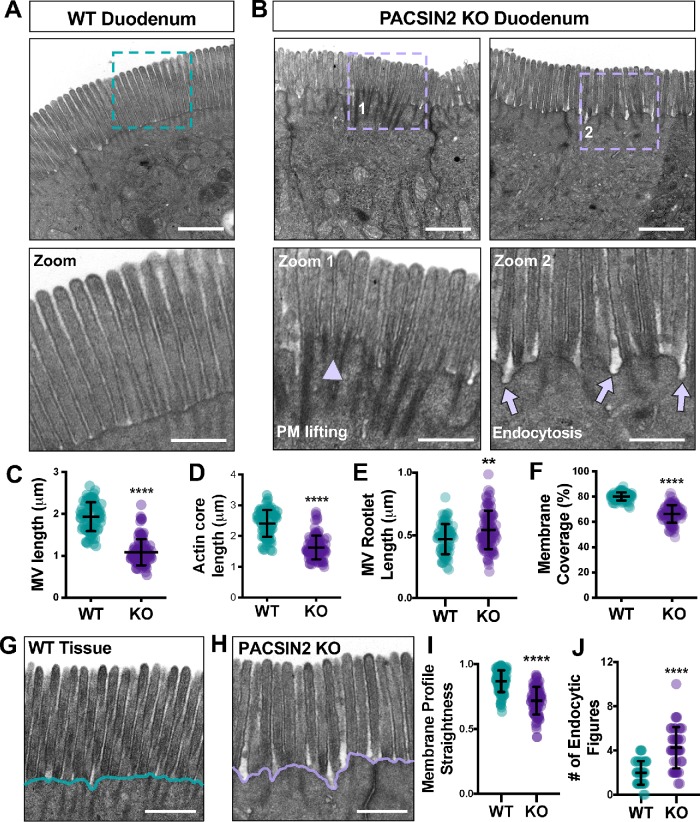
Loss of PACSIN2 disrupts microvillar ultrastructure and organization. (A) TEM image of a WT brush border in a plane parallel to the microvillar axis; teal dashed box indicates region highlighted in zoom panel below. Scale bar, 1 μm. (B) TEM images of PACSIN2 KO brush borders in a plane parallel to the microvillar axis; purple dashed boxes indicate region highlighted in zoom panels below. Arrowhead in zoom 1 highlights membrane lifting; arrows in zoom 2 highlight endocytic events. Scale bars, 1 μm. (C) Quantification of microvillar length (the length of an actin core covered in membrane) in WT (n = 82) and KO (n = 102). Measurements were selected so that only protrusions with actin cores fully visible along their length were scored. (D) Quantification of total microvillar actin core length in WT (n = 83) and KO (n = 102) microvilli. (E) Quantification of microvillar rootlet length in WT (n = 83) and KO (n = 102) microvilli. (F) Quantification of membrane coverage, the percentage of an actin core wrapped in membrane, in WT (n = 83) and KO (n = 102) microvilli. (G, H) Representative images of WT (F) and KO (G) tissue used in the quantification of membrane profile straightness (H); scale bars, 0.5 μm. Teal and purple lines highlight the decreased membrane straightness in KO. (I) Quantification of plasma membrane profile straightness at the base of WT (n = 102) and KO (n = 88) microvilli; total membrane length was measured over 1-μm units. (J) Quantification of the number of endocytic figures, or structures that resemble stalled endocytic intermediates, at the plasma membrane of WT (n = 44 image fields) and KO (n = 44 image fields) brush borders. Error bars indicate ± SD; p values were calculated using a t test (**p < 0.01, ****p < 0.0001).

