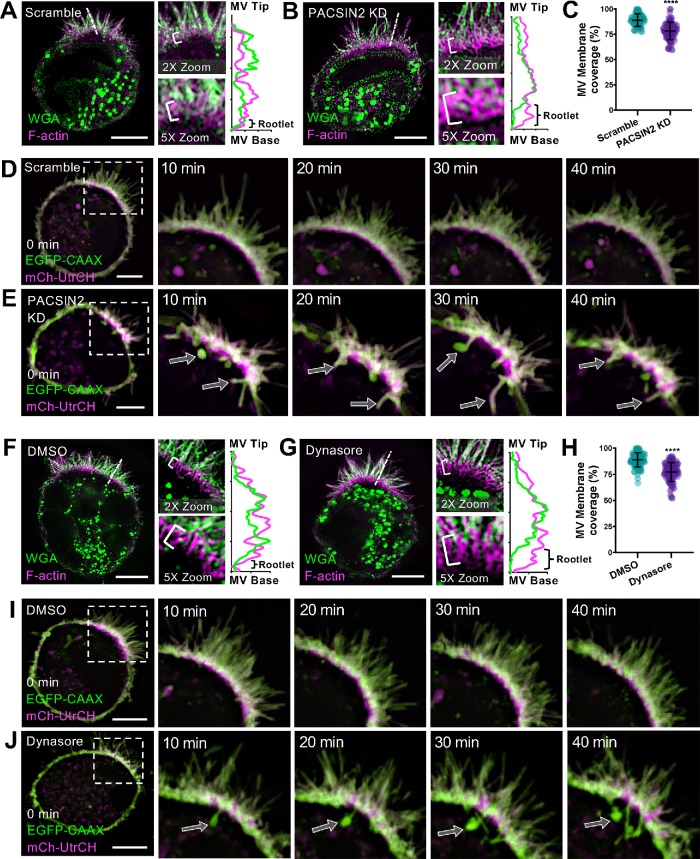
FIGURE 5:
Inhibition of endocytosis reduces microvillar membrane coverage. (A, B) SIM projections of scramble control (A) and PACSIN2 KD (B) W4 cells stained for WGA (membrane, green) and phalloidin (magenta). Brackets in zoom panels indicate actin rootlet lengths. Dashed lines denote where line scans were drawn through a single microvillus to show increased actin rootlet length; membrane (green), actin (magenta). Scale bars, 5 μm. (C) Quantification of microvillar membrane coverage; scramble n = 77 microvilli from 10 cells; PACSIN2 KD n = 88 microvilli from 11 cells. (D, E) Montages of scramble control and PACSIN2 KD W4 cells expressing EGFP-CAAX box (last 10aa of the GTPase HRas; membrane, green) and mCherry-UtrCH (F-actin, magenta). Arrows in the PACSIN2 KD cell (E) indicate membrane tubules forming into the cytosol. Scale bars, 5 μm. (F, G) SIM projections of DMSO control– (F) and 80 μM Dynasore– (G) treated W4 cells stained for WGA (membrane, green) and phalloidin (magenta). Brackets in zoom panels indicate actin rootlet lengths. Dashed lines denote where line scans were drawn to show increased actin rootlet length: membrane (green), actin (magenta). Scale bars, 5 μm. (H) Quantification of microvillar membrane coverage; DMSO n = 104 microvilli from 13 cells; Dynasore n = 105 microvilli from 12 cells. (I, J) Montages of DMSO control– and 80 μM Dynasore–treated W4 cells expressing EGFP-CAAX box (membrane, green) and mCherry-UtrCH (F-actin, magenta). Arrows in the Dynasore-treated cell (J) indicate membrane tubules forming into the cytosol. Scale bars, 5 μm. Error bars indicate ± SD; p values were calculated using a t test (****p < 0.0001).

