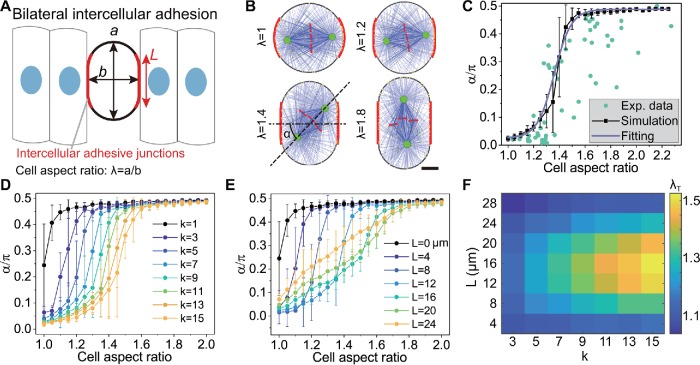
FIGURE 3:
Regulating the spindle orientation via the cell shape and the bilateral intercellular adhesion in the side view. (A) The schematic shows the cell shape and intercellular adhesion of a dividing epithelial cell in the 2D simulation. The cell is stadium-shaped, where the red segments represent the intercellular adhesion region. (B) The snapshots of simulated spindles in the cells with different aspect ratios, but the same adhesive length and adhesive strength (L = 12 µm, k = 11) (see also Supplemental Movie S3). Scale bar: 5 µm. (C) The spindle orientation quantified by the angle between the spindle axis and the adhesion polarity from (B) is plotted against the aspect ratio of the cell shape (mean ± SE, 50 simulations for each case, the same below). The green dots are the experimental data from Chanet et al. (2017). The solid line is the fitting of the simulation results by using Eq. 1. (D) The role of the adhesive strength in governing the spindle orientation. (E) The role of the adhesive length in governing the spindle orientation. The curves in D and E can also be fitted by Eq. 1 (not shown). (F) Through fitting, the critical aspect ratio λT can be obtained, and it is the function of the adhesive strength k and adhesive length L.

