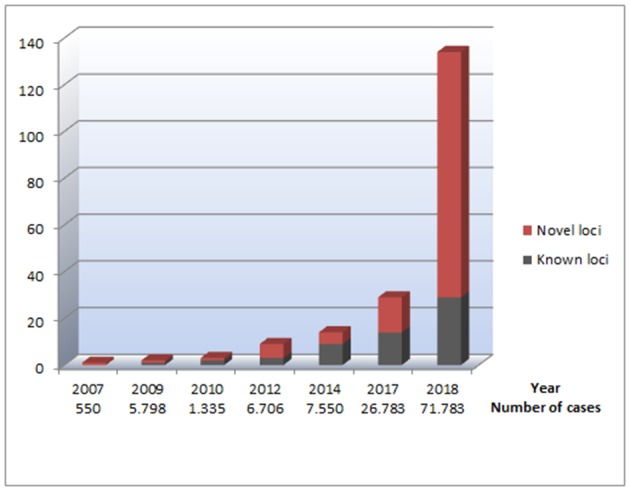
Figure 1.

An overview of genetic loci identified through GWAS performed for AF. The figure illustrates the number of identified loci for AF, based on the data listed in Table 1. The x axis represents which years the different GWAS for AF was performed. Under each year, the total number of cases included in all GWAS for AF the current year is listed, illustrating the relationship between the increasing sample sizes and the increasing number of AF-associated loci identified. The Y axes represent the number of genetic loci associated with AF. The red parts of the columns represent genetic loci that have not previously been reported in relation to AF. The black parts of the columns represent previously reported genetic loci associated with AF, making the total of each column reflect the total number of AF-associated loci at a given time.
