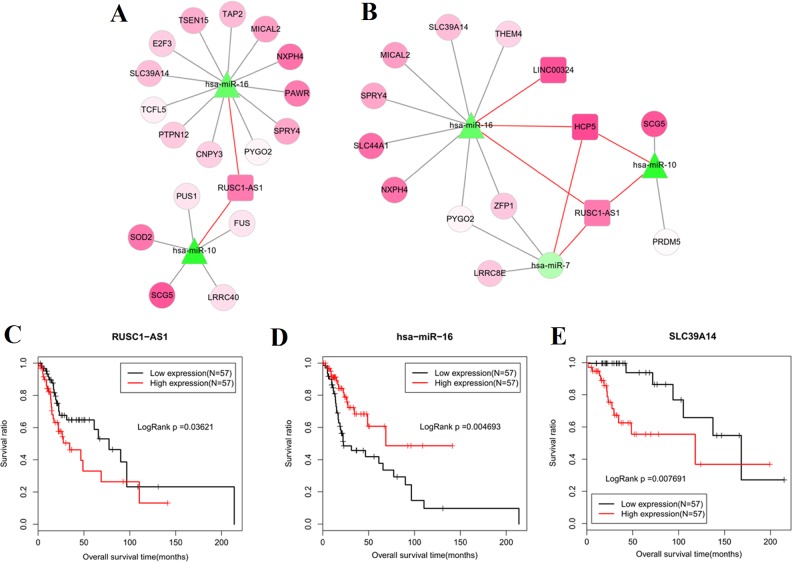
Figure 5. Prognosis related competing endogenous RNAs (ceRNAs) interaction axes.
(A) lncRNA-miRNA-mRNA network for overall survival; (B) lncRNA-miRNA-mRNA network for recurrence free survival. Square nodes represent lncRNAs; triangle nodes represent miRNAs; round nodes represent mRNAs. Edges represent the possible associations between lncRNAs, miRNAs and mRNAs. Red, upregulated; green, downregulated.; Kaplan–Meier analysis of the lncRNA (C), miRNA (D) and mRNA (E) of crucial ceRNA axis in which all lncRNA, miRNA and mRNA were prognosis-related and mRNA was an independent prognostic factor.

