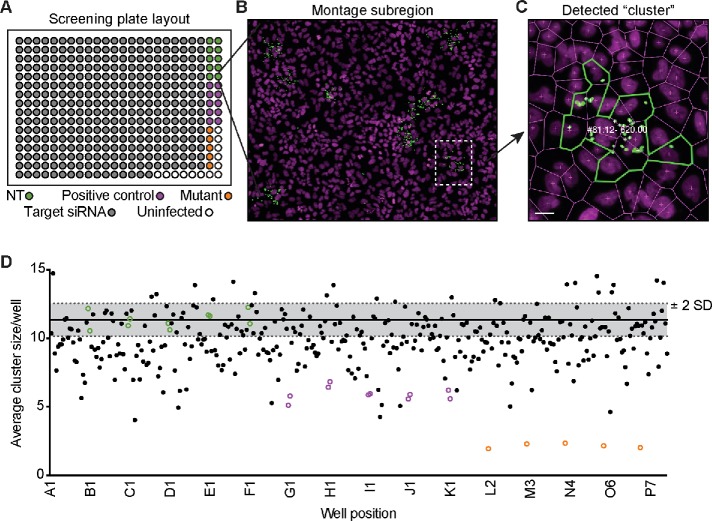
FIGURE 1:
Primary RNAi screen reveals host genes that alter bacterial spread. (A) Screen plate layout with target siRNAs (gray circles), nontarget siRNAs (NT; green circles), positive control siRNAs (purple circles), or with the L. monocytogenes ΔactA mutant (orange circles). (B) Region of the full montage from the screen is shown with bacteria (green) and host nuclei (magenta). Region of interest (white dotted line) expanded in C. (C) Example of a detected cluster (infectious focus) from the screen with the numbers representing “cluster #: infected cells – cumulative GFP signal.” Scale bar = 5 μm. (D) Example run from the primary RNAi screen. NT (green circles), positive controls (purple circles), and the ΔactA mutant (orange circles) are shown along with screen siRNAs (black dots). Gray shaded region represents ±2 SD from the average cluster size (solid black line) of the 10 NT control wells.

