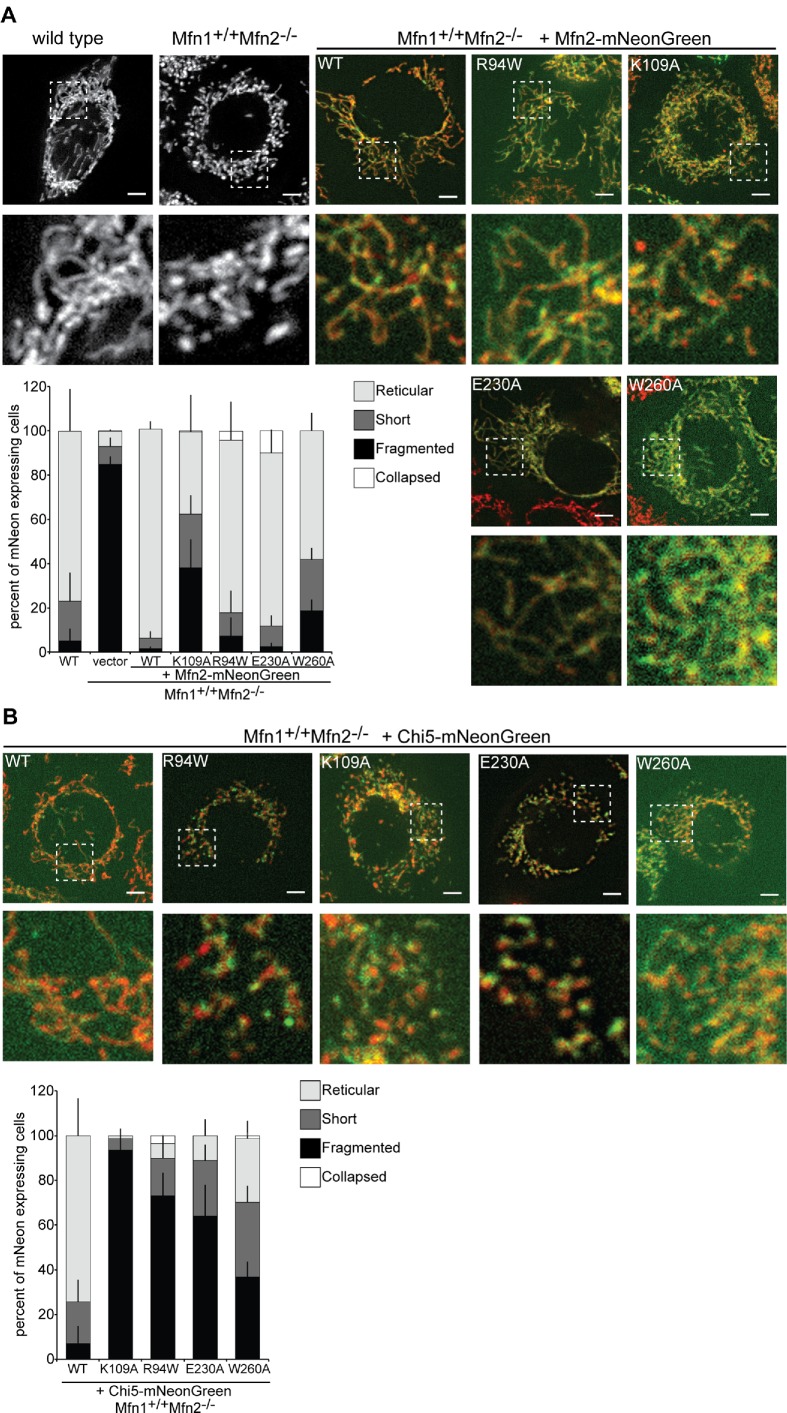
FIGURE 3:
Mfn2 GTPase mutant variants support fusion with endogenous Mfn1, but Chi5 variants do not. (A) Representative images of wild-type and Mfn1+/+ Mfn2−/− cells transduced with either empty vector or Mfn2-NG. Mitochondria were labeled with MitoTracker Red CMXRos and visualized by fluorescence microscopy. Images represent maximum intensity projections. Scale bars are 5 µm. Quantification of the mitochondrial morphology is shown in the graph. Error bars indicate mean + SD from three blinded experiments (n ≥ 100 cells per population per experiment). (B) Representative images of Mfn1+/+Mfn2−/− cells transduced with Chi5-NG. Mitochondria were labeled with MitoTracker Red CMXRos and visualized by fluorescence microscopy. Images represent maximum intensity projections. Scale bars are 5 µm. Quantification of the mitochondrial morphology is shown in the graph. Error bars indicate mean + SD from three blinded experiments (n ≥ 100 cells per population per experiment).

