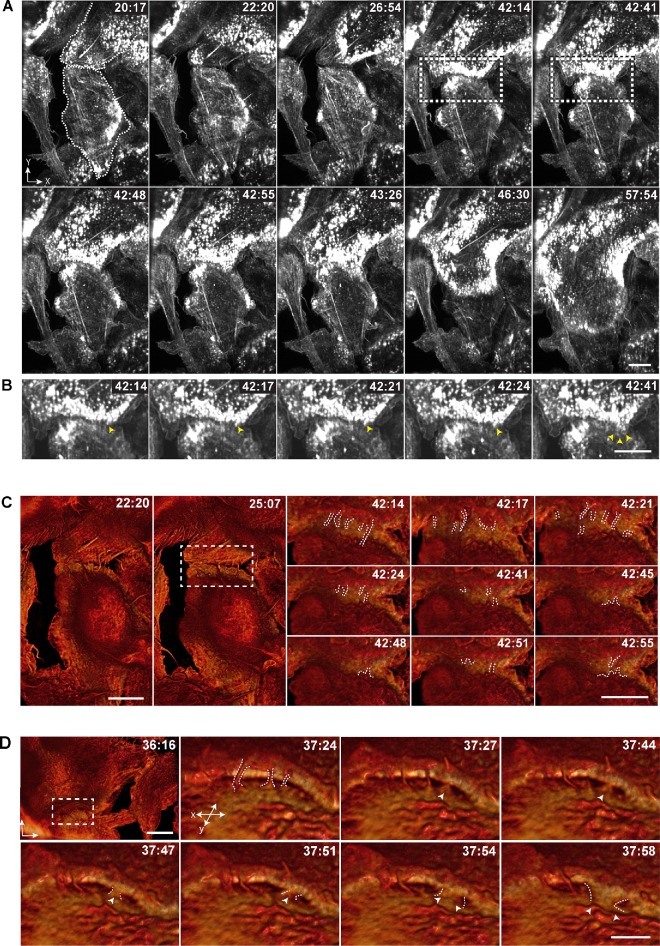
FIGURE 3:
An actin-based protrusion precedes macrophage fusion. (A) LLSM of IL-4–induced fusion of macrophages expressing eGFP-LifeAct. All images shown are maximum-intensity projections. The scale bar is 10 μm. See also Supplemental Video S6. (B) Enlarged images of events occurring between 42:14 and 42:41 min (boxed regions in A). Yellow arrowheads point to the site of fusion. The scale bar is 10 μm. (C) En face isosurface renders of LLSM data from A. The boxed region at 25:07 min corresponds to the subsequent micrographs showing the fusion progress (42:14–42:41 min). Note numerous protrusions (outlined by white dashes) formed between apposing cells. The scale bar is 10 µm. See also Supplemental Video S7. (D) Surface renders of LLSM data from another area of fusing macrophages showing contact of a fusion-competent protrusion (a single white arrowhead; 37:27–37:51 min) followed by its apparent expansion (two white arrowheads; 37:54–37:58 min). The scale bar is 5 µm. The boxed area at 36:16 min (scale bar, 10 µm) corresponds to the subsequent micrographs (37:24–37:58 min). Time in each micrograph is shown as minutes:seconds. See also Supplemental Video S8.

