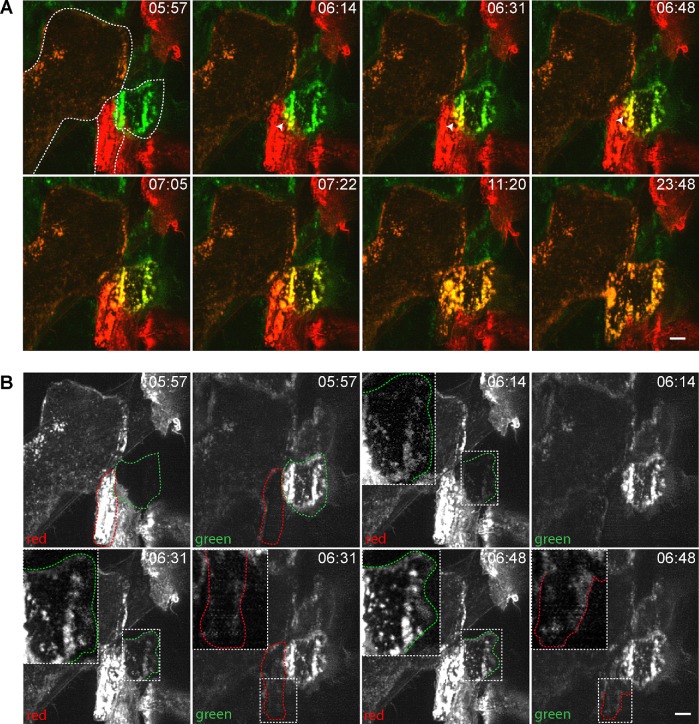
FIGURE 4:
Mixing macrophages expressing eGFP-LifeAct and mRFP-LifeAct shows asymmetric actin integration. (A) Macrophage fusion in a mixed population of eGFP/mRFP-LifeAct macrophages. Two mononuclear cells expressing eGFP-LifeAct and mRFP-LifeAct undergoing fusion are outlined in the image taken at 5:57 min. A site of eGFP- and mRFP-LifeAct integration is indicated by white arrowheads at 6:14 and 6:48 min. (B) Split-channel view of the fusion event shown in A. The boxes outlined in white dashed lines in the images taken at 6:14–6:48 min correspond to the areas where integration of mRFP-LifeAct into the eGFP-LifeAct-containing cells is observed. The enlarged images of the same areas are shown as insets. The scale bars are 5 μm. See also Supplemental Videos S9 and S10.

