FIGURE 5:
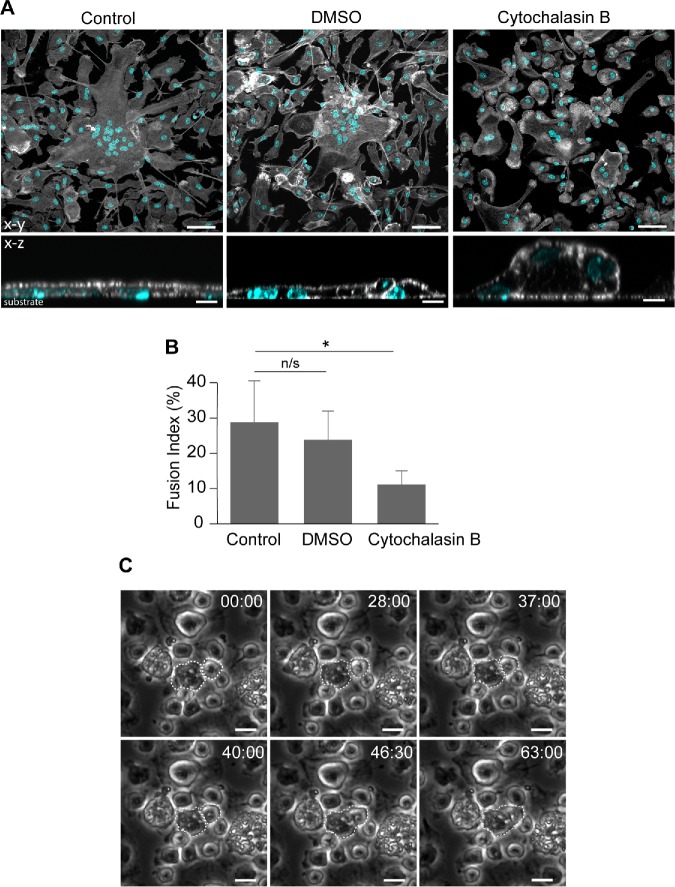
Cytochalasin B treatment reduces macrophage fusion. (A) Confocal micrographs of control (untreated and DMSO-treated) as well as cytochalasin B–treated (2.5 µM) macrophages 24 h after incubation in the presence of IL-4. The cells were labeled with Alexa Fluor 488–conjugated phalloidin (white) and DAPI (teal). The bottom panels show the x-z sections of control untreated (left), control DMSO-treated (middle), and cytochalasin B–treated (right) MGCs. The scale bars are 50 and 10 µm in the top and bottom panels, respectively. (B) Quantification of the fusion index in the population of untreated and cytochalasin B–treated macrophages. DMSO was used as vehicle control for cytochalasin B treatment. Three to five random 20× fields per sample were used to count nuclei (100–150 nuclei/field; total ∼1500 nuclei). Results shown are mean ± SD from three independent experiments. *p < 0.01. (C) Single cytochalasin B–treated macrophages that undergo fusion do not form protrusions. The cells that fuse are outlined. The scale bars are 10 μm.

