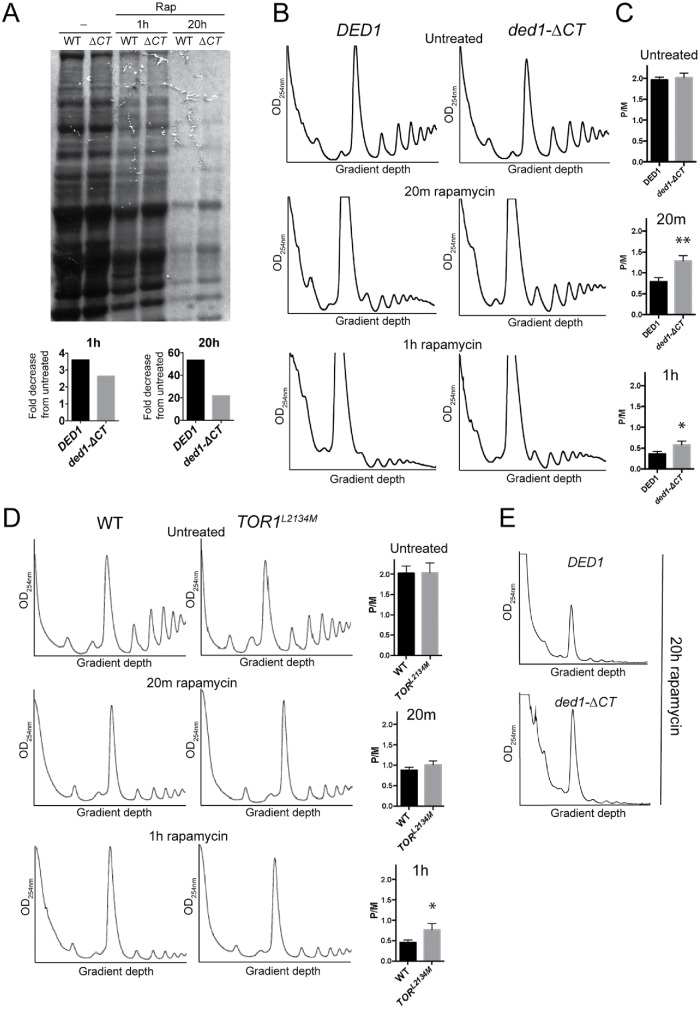
FIGURE 2:
Ded1 has a role in repressing translation following rapamycin treatment. (A) DED1 and ded1-∆CT cells were grown in the presence of rapamycin for 0, 1, or 20 h. 35S-Methionine (200 µCi ) was added to the medium 1 h prior to harvest. SDS–PAGE and autoradiography of the samples were performed to show incorporation of 35S-Met into new proteins, and the total signal in each lane was quantified to calculate fold difference of ded1-∆CT compared with DED1 (numbers below lanes), or fold decrease from untreated (bar graphs). (B) Cultures of the indicated strains were grown in the presence of rapamycin for the indicated time, and polysome profiles were generated by subjecting cell lysates to 7–47% sucrose density centrifugation and OD254 analysis. A representative result is shown. (C) The monosome/polysome (P/M) ratio in B was determined by comparing the sum of the areas of the polysome peaks to the area of the monosome peak. Each P/M ratio shown is the mean and SEM from of three to four independent trials. **p < 0.01 vs. wild-type DED1, *p < 0.05 vs. wild-type DED1. (D) WT and TOR1L2134M strains were grown in the presence of rapamycin for the indicated time, and polysome profiles were generated as in B. A representative trace is shown with the P/M ratio (mean and SEM of three independent trials) shown to the right. *p < 0.05 vs. WT. (E) Representative traces of polysome profiles from the indicated strains after 20 h of rapamycin treatment.

