FIGURE 5:
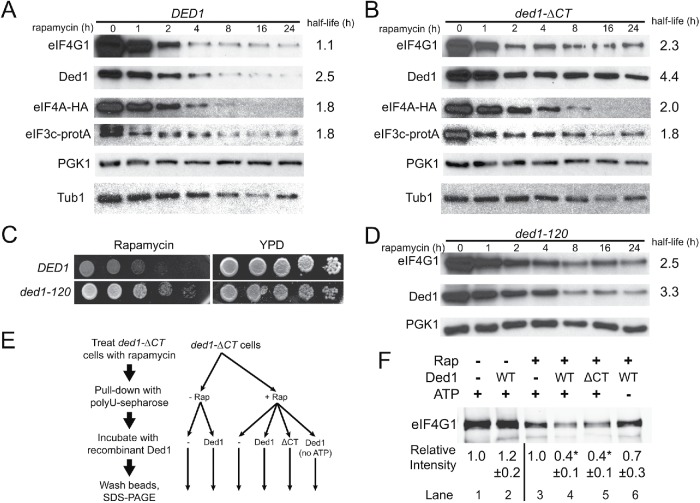
The Ded1 C-terminus and enzymatic activity are required for eIF4G1 remodeling and degradation. (A) DED1 cells were subjected to a time course of rapamycin treatment, and cell extracts were prepared and blotted for the indicated translation initiation factors (and PGK1 and Tub1 as a loading controls) as in Figure 3. Half-lives were determined via curve fitting, with 95% confidence intervals of 0.8–1.7 h (4G1), 2.3–2.7 (Ded1), 1.4–2.5 (4A), and 1.3–2.9 (3c). (B) Time course as in A for ded1-∆CT cells. Half-life 95% confidence intervals were 1.7–3.7 (4G1), 3.7–5.3 (Ded1), 1.6–2.7 (4A), and 1.1–5.7 (3c). The K values for eIF4G1 and Ded1 for B were significantly different from A by an extra sum-of-squares F test, while eIF4A and eIF3c were not. (C) DED1 and ded1-120 cells were serially diluted onto rich media ± rapamycin (200 ng/ml) and incubated at 30°C. (D) Time course as in A for ded1-120 cells, blotting for the indicated proteins. Half-life 95% confidence intervals were 1.9–3.8 (4G1) and 2.8–4.2 (Ded1), and the K values for eIF4G1 and Ded1 were significantly different from A by an extra sum-of-squares F test. E Diagram showing experimental workflow for F. Cells were incubated ± rapamycin for 40 min and then pull downs with polyuridine sepharose were performed to isolate RNA-binding proteins. Pull downs were then incubated with 2 μM recombinant Ded1 or ded1-∆CT protein ± 2 mM ATP. (F) Blot of eIF4G1 levels from pull downs described in E. Densitometry was performed and normalized to eIF4G1 levels without added Ded1 separately for rapamycin samples and untreated controls. Values represent the mean of four to five independent experiments for each condition. *p < 0.01 vs. no Ded1 control by Student’s t test.

