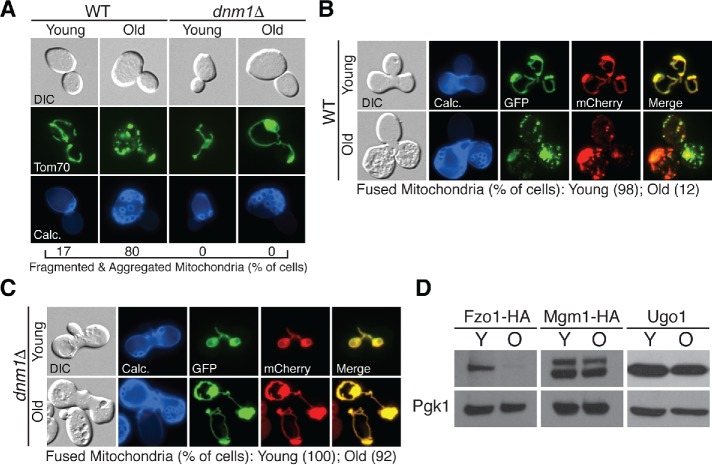
FIGURE 1:
Mitochondrial fusion is reduced in aged yeast cells. (A) Representative single Z-plane images of wild-type (WT) and dnm1Δ yeast of the indicated age expressing Tom70-GFP. n = 30 cells. For A–C, age (number of cell divisions) identified by calcofluor (Calc) staining of bud scars. Age ranges: wild-type (WT), young = 0–3, old = 16–22; dnm1Δ, young = 0–3, old = 15–21. DIC = differential interference contrast. (B, C) Representative single Z-plane fluorescent images of WT (B) or dnm1Δ (C) zygotes derived from mating of Tom70-GFP and Tom70-mCherry expressing haploid cells of the indicated age. n = 50 cells for both B and C. (D) Whole cell extracts from young (Y) and old (O) cells expressing the indicated proteins were analyzed by Western blot with anti-HA, anti-Ugo1, and anti-Pgk1 antibodies. Age ranges (n = 30 cells): Fzo1-HA, Y = 0–3 divisions, O = 6–10; Mgm1-HA, Y = 0–3, O = 6–10; Ugo1, Y = 0–3, O = 12–15.

