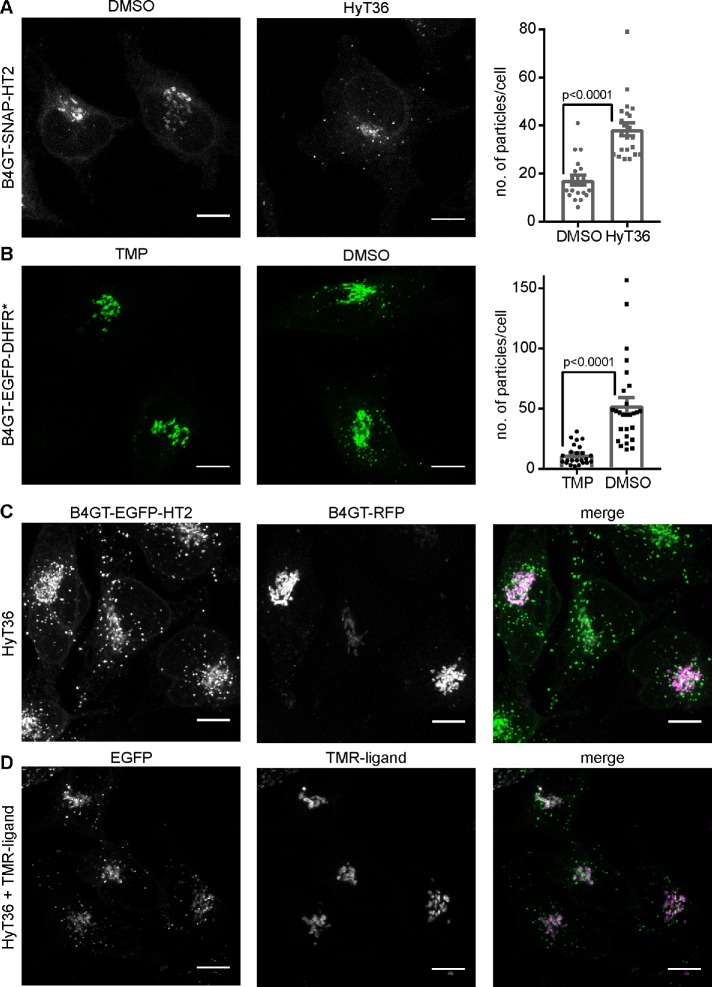
FIGURE 2:
Formation of Golgi QC carriers containing Golgi QC model substrates. (A) Left panel: representative confocal microscopy images of HeLa cells expressing B4GT-SNAP-HT2 labeled with a fluorescent SNAP ligand at time 0 and incubated with DMSO control or HyT36 for 1 h at 37°C. Right panel: particles per cell were quantified in FIJI (n = 19 for DMSO, n = 22 for HyT36). (B) Left panel: representative confocal microscopy images of HeLa cells expressing B4GT-EGFP-DHFR* incubated for 4 h at 20°C followed by 1 h at 37°C with the stabilizer TMP or TMP washed out and treated with DMSO. Right panel: Particles per cell were quantified in FIJI (n = 24 for TMP and n = 27 for DMSO). (C) B4GT-EGFP-HT2–expressing HeLa cells were transfected with B4GT-RFP and treated with HyT36 for 4 h at 20°C followed by 1 h at 37°C. (D) B4GT-EGFP-HT2–expressing HeLa cells were treated with HyT36 and a HT TMR ligand for 4 h at 20°C followed by 1 h at 37°C. All images are maximum projections of z-stacks. Scale bars correspond to 10 µm. Bar graphs represent mean ± SEM, p values (t test) are shown.

