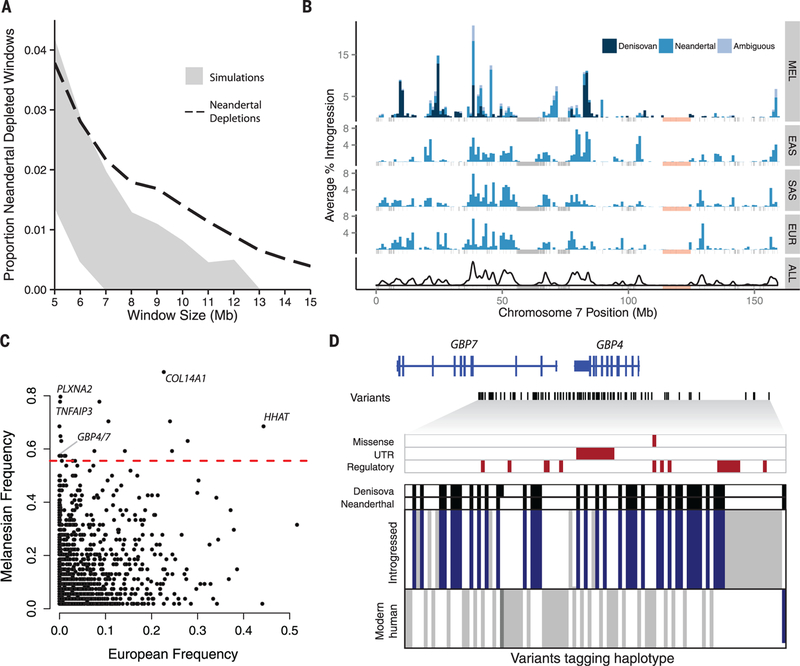
Fig. 4. Maps of archaic admixture reveal signatures of purifying and positive selection.
(A) Proportion of windows significantly depleted of Neandertal introgression in Europeans and East Asians (dashed line) versus what is expected in neutral demographic models (95% confidence interval in gray). (B) Distribution of Neandertal and Denisovan sequences across chromosome 7 in Melanesians (MEL), East Asians (EAS), South Asians (SAS), and Europeans (EUR), and then summed across all populations (ALL). Masked regions are shown as gray vertical lines. An 11.1-Mb region significantly depleted of Denisovan and Neandertal ancestry in all populations is shown in light pink. (C) The frequency of archaic haplotypes in Melanesians versus Europeans. The red line indicates the 99th percentile defined by neutral coalescent simulations. Notable genes are labeled. (D) Visual representation of a high-frequency haplotype encompassing GBP4 and GBP7. Rows indicate individual haplotypes, and columns denote variants that tag the introgressed haplotype (14). Alleles are colored according to whether they are ancestral (white), derived variants that match both archaic genomes (blue), derived variants that match one archaic genome (dark gray), or derived but do not match either archaic genome (light gray). Archaic sequences are represented above, with black denoting derived variants. Missense, untranslated region (UTR), and putative regulatory variants (14) are highlighted with red boxes.

