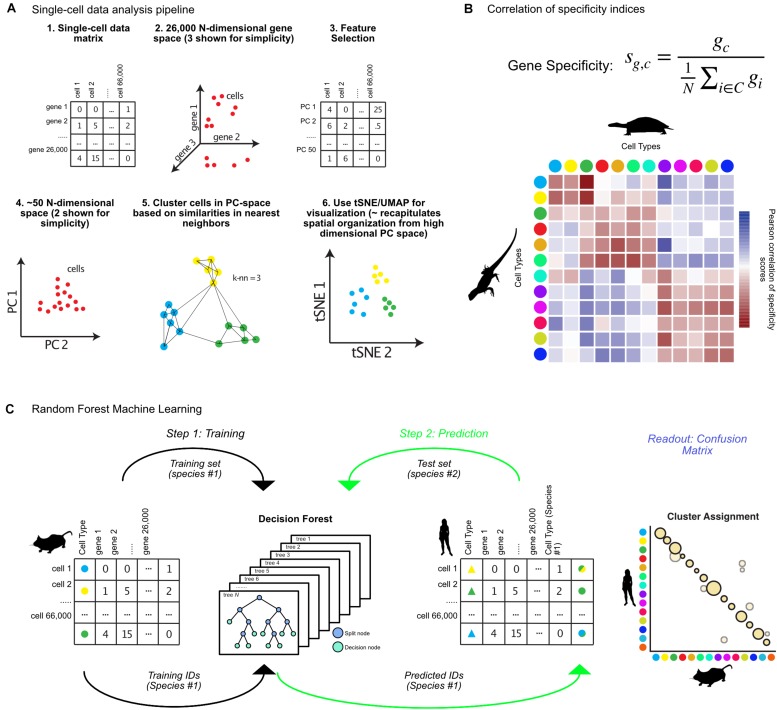
FIGURE 1.
Matching cell clusters in single-cell RNA-seq across species. (A) Overview of bioinformatic pipeline for single-cell sequencing analysis from the R toolkit Seurat, including feature selection, dimensionality reduction, and graph-based clustering. Seurat takes a cell by gene expression matrix (steps 1, 2), and first identifies features (genes) for dimensionality reduction (steps 3, 4). Using principal components, Seurat identifies clusters using graph-based methods, then visualizes resulting clusters using tSNE or UMAP (steps 5, 6). (B) Equation for calculation of gene specificity, and example correlation of these values between turtle and lizard cell types (colored dots) where Pearson correlation coefficient values in red indicate positive correlation and blue indicate negative correlation. (C) Random forest machine learning algorithms for identifying cross-species cell type annotations involves first training an algorithm on cell types from one species (step 1), then predicting which of those cell types each cell from a different species most resembles (step 2), which results in a confusion matrix (Readout). Animal silhouettes were obtained from PhyloPic (www.phylopic.org). All silhouettes were used under the Public Domain Dedication 1.0 license, except the image of a turtle, which is attributed to Scott Hartman.

