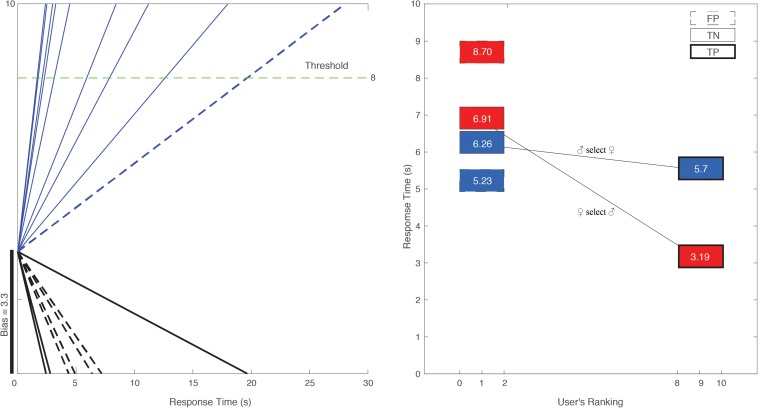
FIGURE 3.
(Left) A male user’s partner selection modeled through DDM. We show (x-axis) the time the user took to make a selection when faced with candidate profiles. The user selected multiple women whose rank was above 8 (blue solid lines) and rejected multiple women whose rank was below 8 (black solid lines). We mark the selection as “True Positive” (“hit”) and the rejection of lower ranked women as “True Negative.” “Miss” (“False Negative”) would be a rejection of a woman ranked above 8 (dashed black lines) and “False Positive” would be the selection of a low-ranked woman (dashed blue line). Based on the user’s prior choices we can also estimate his “bias.” The user tends to accept 33% of the women he sees. His response time is shorter when selecting a high-ranking woman and rejecting a low-ranking one. (Right) Mean response time for men selecting women (blue) and women selecting men (red) who are ranked 8–10 (True Positive; solid bold lined square) or rejecting ones ranked below 2 (“True Negative”; non-bold solid lined squares). Accepting a user that others typically reject (“False Positive”) is depicted with dashed lines.

