S1.
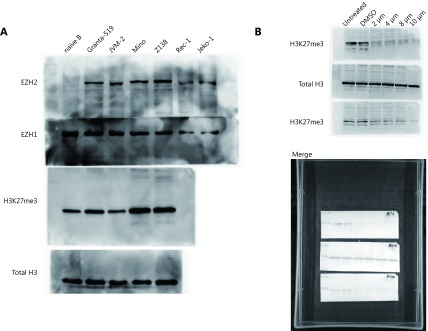
Full gel images of Western blot depicted in Figure 1D and Figure 3G. (A) Protein levels of EZH1 and EZH2 as well as H3K27me3 in naïve B cells and 4 MCL cell lines were determined by western blot. (B) Z138 and Mino cells were treated with increasing dose of UNC1999 for 48 h and determined with the level of EZH2, EZH1 and H3K27me3.

