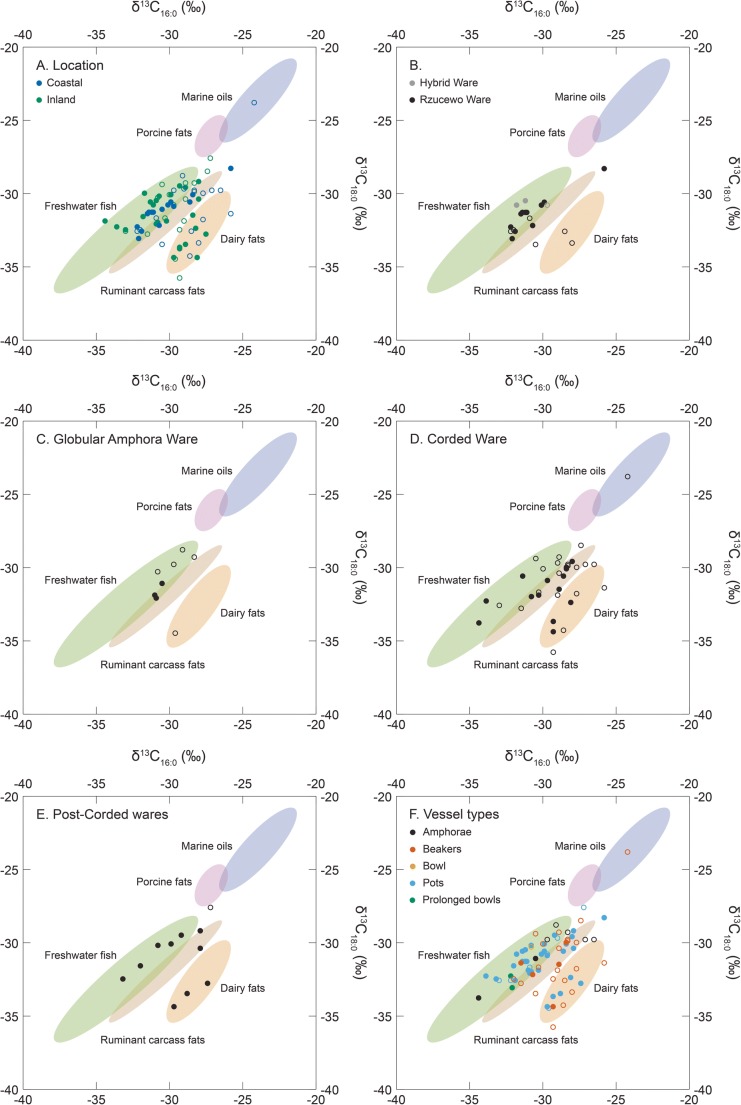
Fig. 6.
δ13C values of C16:0 and C18:0n-alkanoic acids extracted from 48/64 vessels analysed in this study alongside data (n = 27) obtained from contemporaneous vessels from the circum-Baltic region (data from Cramp et al. 2014a; Heron et al. 2015; Piličiauskas et al. 2018a). The ellipses are derived from modern authentic reference animals and are plotted at 68% confidence (Dudd 1999; Oras unpublished; Oras et al. unpublished; Pääkkönen et al. accepted). Closed circle—sample with aquatic biomarkers, open circle—sample without aquatic biomarkers

