
Figure 3 |. The impact of any edema on PROMIS domain scores at enrollment in the CureGN study.
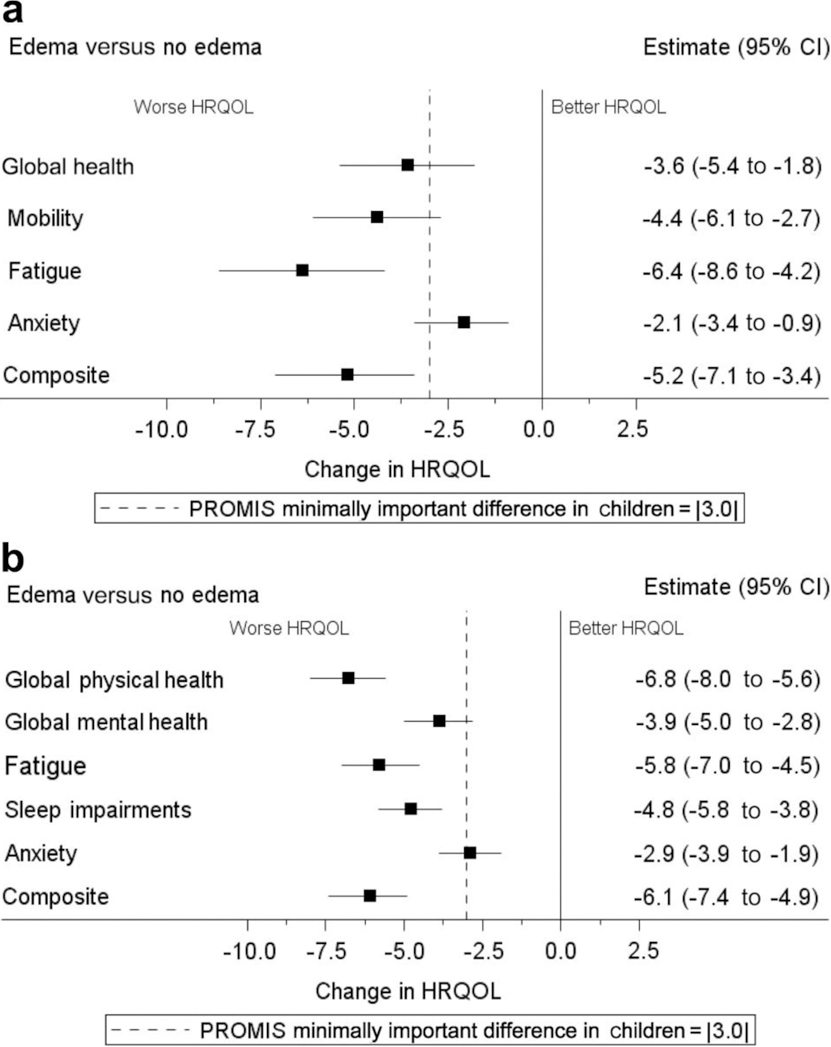
Plots of (a) children and (b) adults show the adjusted linear regression coefficients (β) from multivariable models, with tails indicating lower and upper confidence limits. For ease of comparison, each β estimate has been plotted as the negative of its absolute value, in which negative numbers indicate a worse patient-reported outcome. The dashed line denotes the minimally important difference from baseline. CI, confidence interval; HRqOl, health-related quality of life; PROMIS, Patient-Reported Outcomes Measurement Information System.