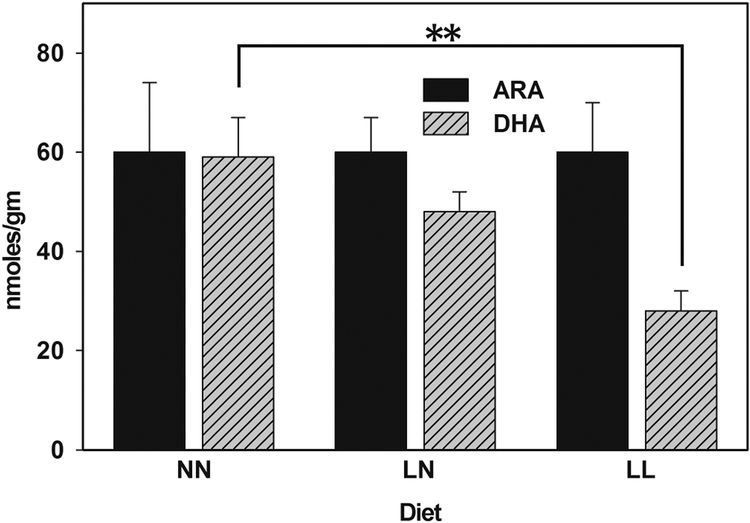
Figure 2. An ω3-deficient diet reduces DHA concentrations in offspring.
The data represents the mean and standard error of 8 samples from 4 animals. Numerical results are provided in table S1. “**” indicates a difference with P < 0.01 by T-test. NN diet – replete with ω3 fatty acids throughout development, and thereafter for 6 months; LN – an ω3-deficient diet during development, then switched to an ω3-replete diet; LL – mice fed on an ω3-deficient diet throughout.

