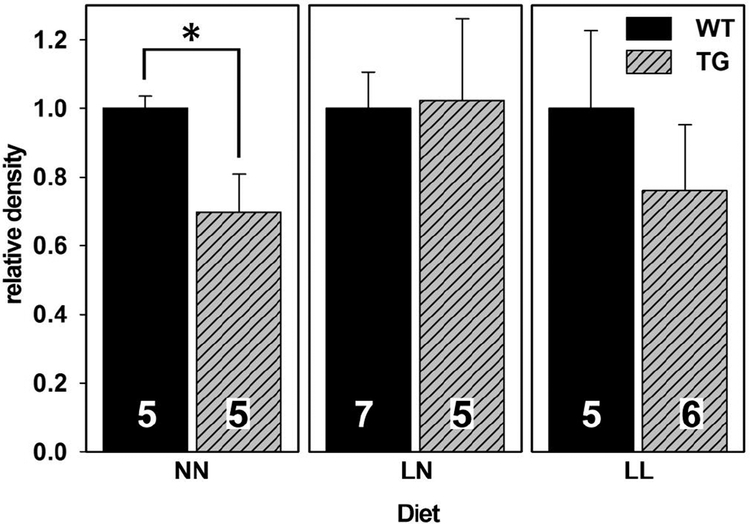
Figure 3. An ω3-deficient diet reduces differences between WT and TG mice in hippocampal PSD95 expression.
Each panel represents a different diet group, and results are normalized to 1.0 for results from WT brains. The number of animals represented by each vertical bar is indicated. “*” indicates a difference with P < 0.05 by T-test. Because Western blots for each diet group were done on different nitrocellulose membranes, valid comparisons may only be made within each diet group.

