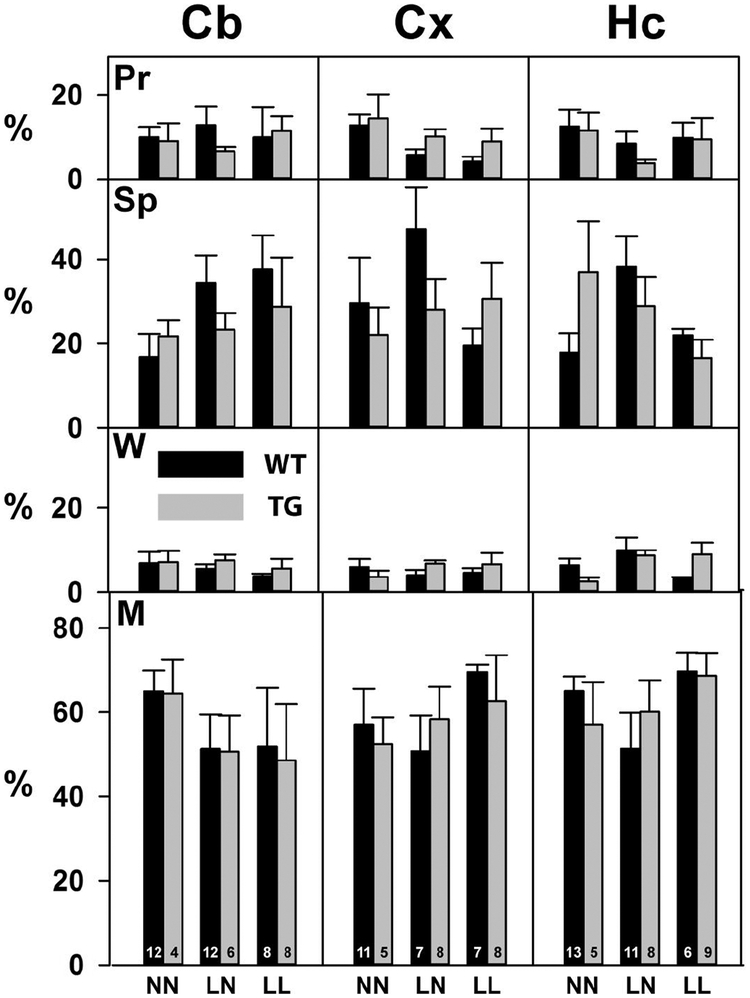
Figure 4. Changes in the ω3 content of diets do not significantly change the distribution of 14C-ARA.
Extracts from the Cb, Cx and Hc of WT and TG mice in the three diet groups were separated into four fractions as described in Figure 1. The radioactivity in each fraction is expressed as a percentage of the total in all fractions for each sample. (Pr) The protein-rich pellet from the BDMU. (Sp) The protein depleted BDMU supernatant. (W) Water-soluble methanol-insoluble materials in the BDL. (M) Methanol-soluble materials in the BDL. There were no statistical differences between groups. The data represent the mean and standard error of results from the number of animals indicated at the base of the bars in the bottom panel.

