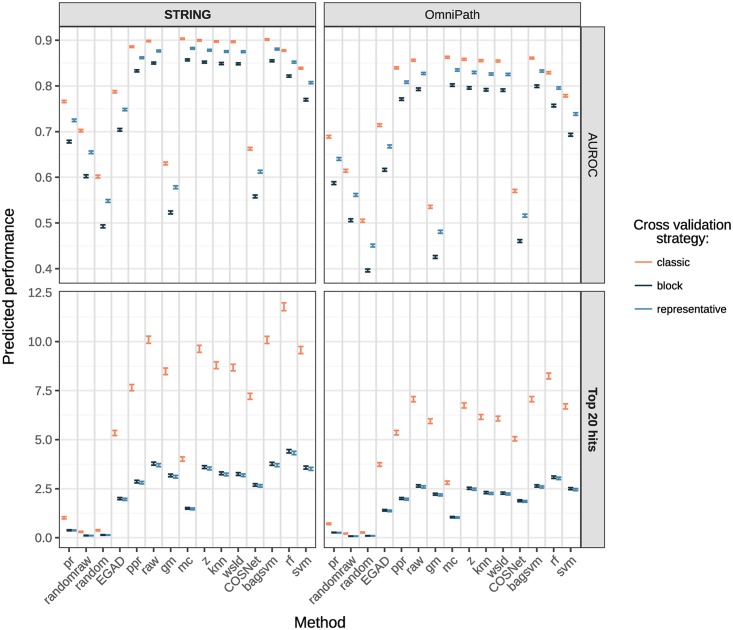
Fig 3. Performance predicted for AUROC and top 20 hits through the additive explanatory models.
Each row corresponds to a different model and error bars depicts the 95% confidence interval of the additive model prediction, averaging over diseases. In bold, the main network (STRING) and metric (top 20 hits). The exact values can be found in Table I in S1 Appendix.

