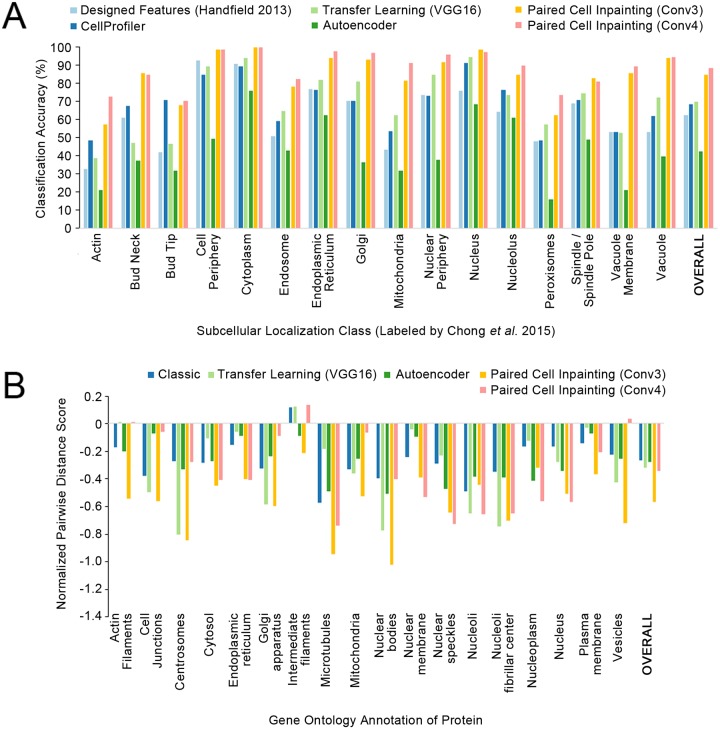
Fig 2. Quantitative comparisons of paired cell inpainting features with other unsupervised feature sets.
(A) Overall and class-by-class performance benchmark for yeast single cell protein localization classes using unsupervised feature sets and a kNN classifier (k = 11) on our test set. For all approaches extracting features from CNNs (Transfer Learning, Autoencoder, and Paired Cell Inpainting), we extract representations by maximum pooling across spatial dimensions, and report the top-performing layer. We report the overall accuracy as the balanced accuracy of all classes. (B) The normalized pairwise distance between cells with the same localization terms according to gene ontology labels, for proteins in the Human Protein Atlas. A more negative score indicates that cells are closer in the feature set compared to a random expectation.

