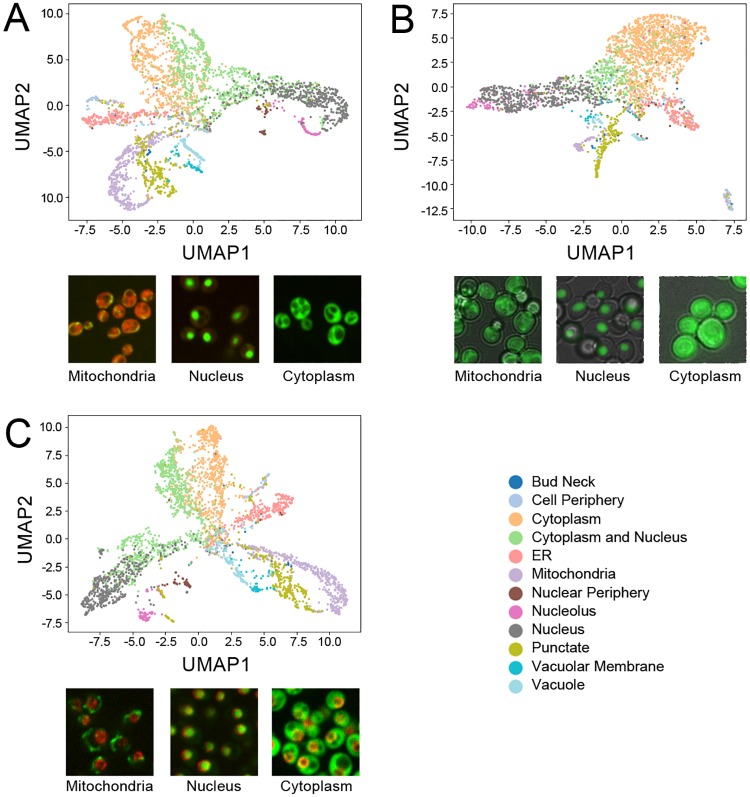
Fig 3. UMAP representations of protein-level paired cell inpainting representations for three independent yeast image datasets.
Protein-level representations are produced by averaging the features for all single cells for each protein. A) shows the CyCLOPS WT2 dataset, B) shows the dataset of Weill et al., and C) shows the dataset of Tkach et al. All UMAPs are generated with the same parameters (Euclidean distance, 20 neighbors, minimum distance of 0.3). Embedded points are visualized as a scatterplot and are colored according to their label, as shown in the shared legend to the bottom right; to reduce clutter, we only show a subset of the protein localization classes. Under each UMAP, we show representative images of mitochondrial, nucleus, and cytoplasm labels from each dataset.

