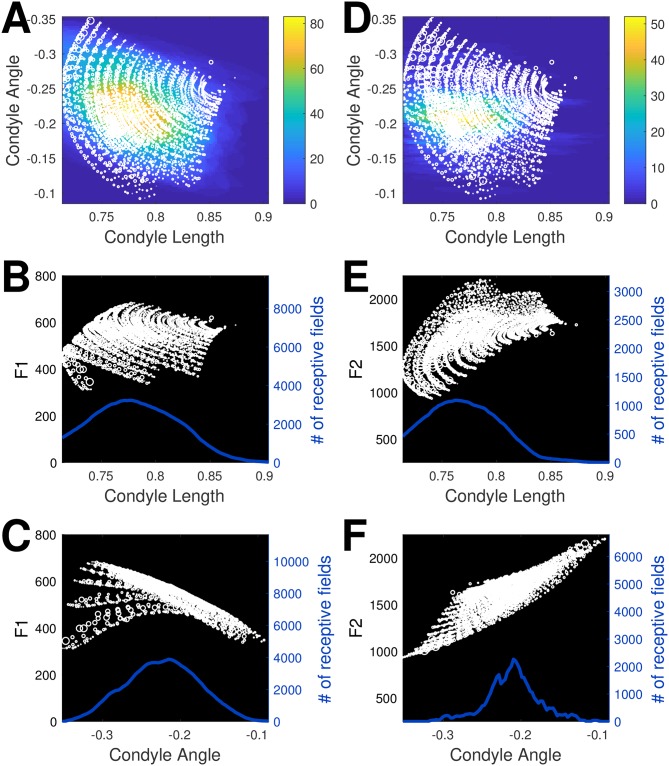
Fig 4. Learned LWPR transformations from CASY articulatory parameters to acoustics.
Predicted formant values are shown as white circles. The width of each circle is proportional to the absolute value of the error between the actual formant values and the formant values predicted by the LWPR model. The density distributions reflect the number of receptive fields that cover each point (represented as colors in A, D and the height of the line in B, C, D, F). (A-C) show F1 values. (D-F) show F2 values.

