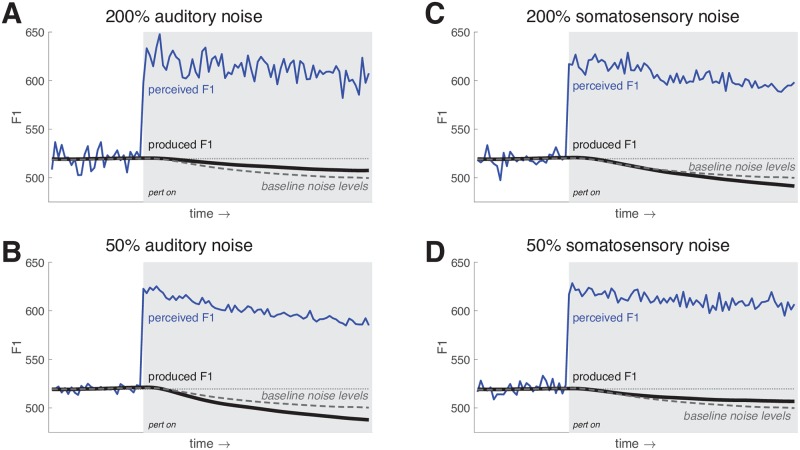
Fig 7. FACTS model simulations of the response to a +100 Hz perturbation of F1.
(A) and (B) show the effects of altering the amount of noise in the auditory system in tandem with the observer’s estimate of that noise. An increase in auditory noise (A) leads to a smaller perturbation response, while a decrease in auditory noise (B) leads to a larger response. (C) and (D) show the effects of altering the amount of noise in the somatosensory system in tandem with the observer’s estimate of that noise. The pattern is the opposite of that for auditory noise. Here, an increase in somatosensory noise (A) leads to a larger perturbation response, while a decrease in somatosensory noise (B) leads to a smaller response. The baseline perturbation response is shown as a dashed grey line in each plot.

