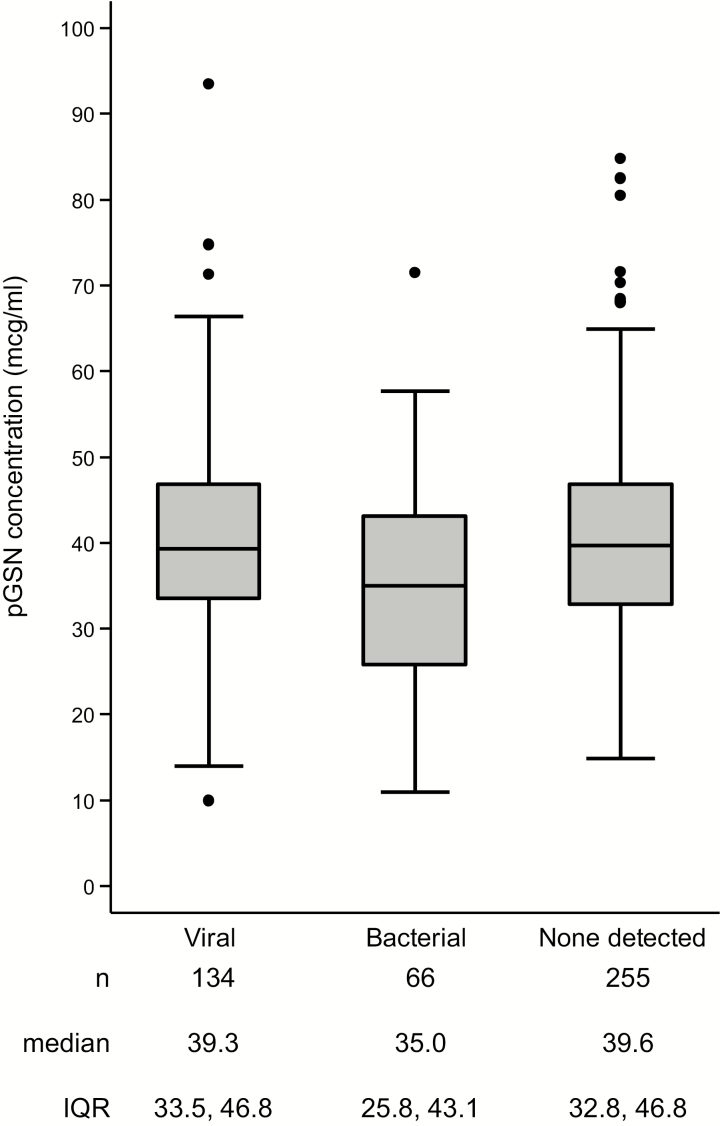
Figure 4.
Box plot of plasma gelsolin concentration by the following detected pathogen type: viral, bacterial, and no pathogen detected. The central horizontal line of each box plot represents the median, with the box denoting the interquartile range (IQR), the whiskers representing 1.5 times the IQR, and dots showing outliers beyond the whiskers. Abbreviations: IQR, interquartile range; pGSN, plasma gelsolin.

