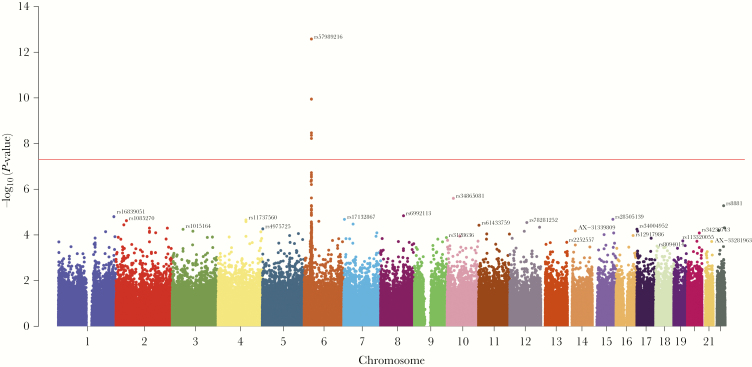
Figure 1.
Single-nucleotide polymorphisms (SNPs) associated with viral load. The Manhattan plot shows the association between SNPs and log10 viral load in the cohort. Each SNP is represented by a point and plotted by chromosomal location (x-axis), and –log10(P-value) per SNP is shown on the y-axis. Genome-wide significance is indicated by the horizontal red line (P-value < 5 × 10⁻⁸).

