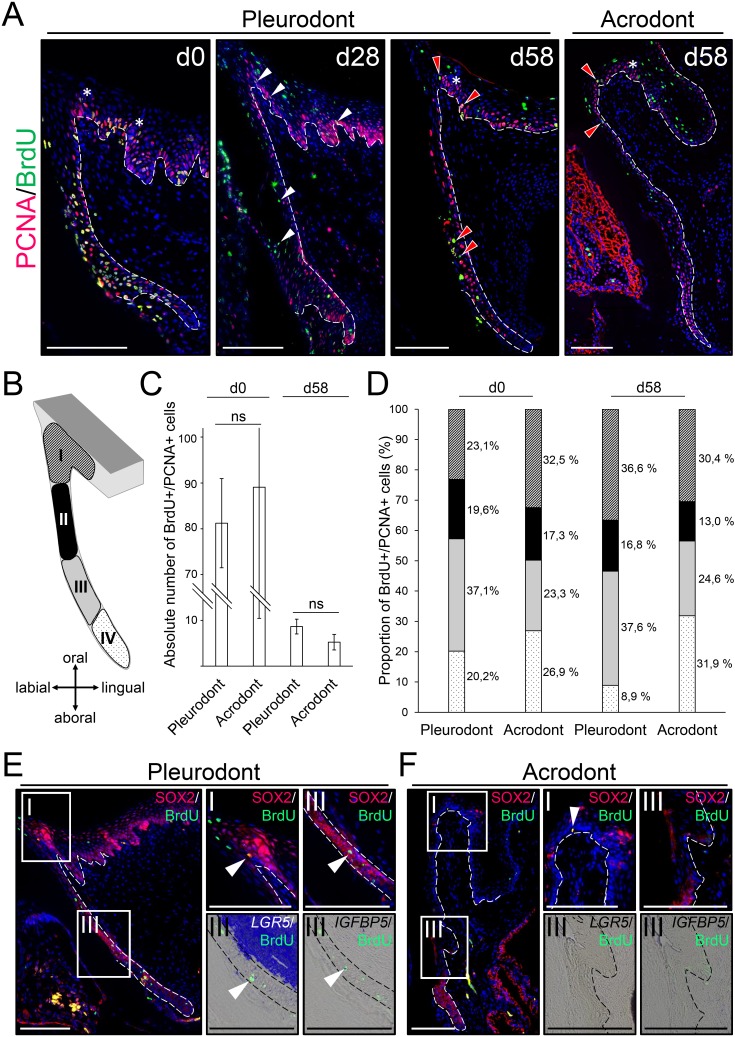
Figure 3. Slow-cycling label-retaining cells (LRCs) accumulate in two different regions of bearded dragon teeth.
(A) Double IHC for PCNA (red staining) and BrdU (green) in pleurodont (left and middle panels) or acrodont (right) tooth sections collected from bearded dragons at 0 (d0), 28 (d28), and 58 (d58) days of chase after the first week of BrdU pulse. White arrowheads indicate the scattering of BrdU/PCNA-double positive cells throughout the dental epithelium at d28, and red arrowheads show the clustering of BrdU/PCNA-double positive LRCs in both OE and DL at d58. White asterisks indicate the position of taste buds in the OE, and white dashed lines delimitate the epithelium-mesenchyme junction. Scale bars: 100 μm. (B) Schematic drawing of the dental subdivisions used for cell quantification: I, OE, defined as a portion of epithelium directly lingual to the DL; II, external DL; III, deep DL; IV, SDL. (C, D) Total amount of BrdU/PCNA-double positive cells in the entire dental epithelium (C; dental zones I-IV) or relative distribution of BrdU/PCNA-double positive cells in the individual dental subdivisions (D; color-code as in (B)) of pleurodont and acrodont teeth at d0 and d58, n = 3 per group (ns, non-significant). (E, F) IHC for SOX2 (red staining) and BrdU (green; left, middle top, and right top panels) or double IHC/ISH for LGR5 (middle bottom) or IGFBP5 (right bottom) with BrdU in parallel sections of pleurodont (E) and acrodont (F) teeth at d58. Insets show high magnifications of OE (dental zone I as in (C)) or DDL (dental zone III) positive stainings. White arrowheads indicate co-expression of SOX2, LGR5, or IGFBP5 with BrdU. White or black dashed lines delimitate the epithelium-mesenchyme junction. Scale bars: 100 μm.

