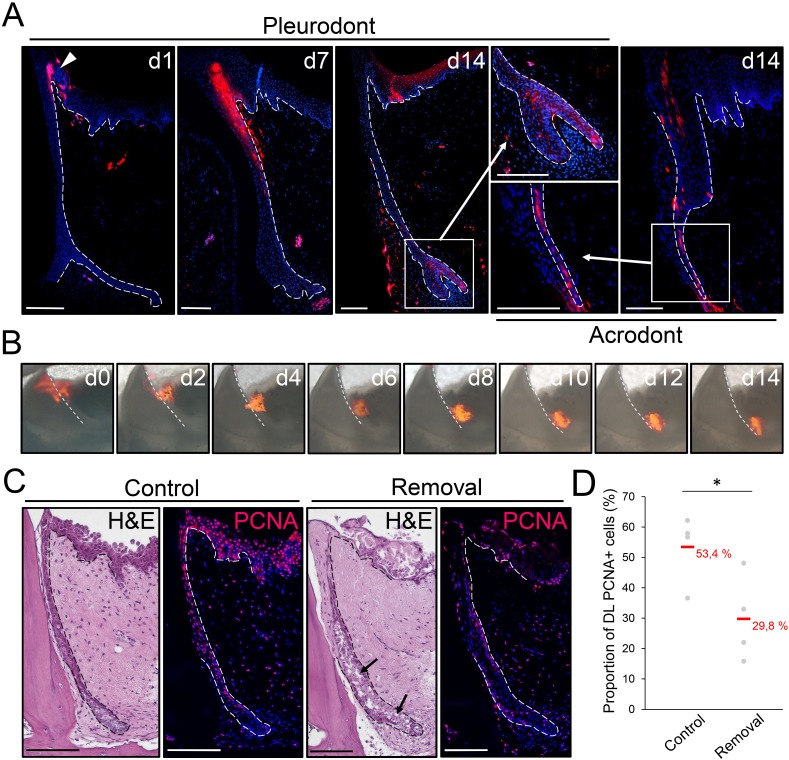
Figure 4. The OE contributes to SDL both in vivo and ex vivo.
(A) DiI fluorescence (red staining) in pleurodont (left and middle panels) or acrodont (right) tooth sections collected from bearded dragons at 1 (d1), 7 (d7), and 14 (d14) days after in vivo DiI administration at the OE-DL junction. Cell nuclei are counterstained with DAPI (blue). The arrowhead at d0 indicates the site of administration of DiI in the OE. High magnifications of the SDL in pleurodont and acrodont teeth are shown at d14 (insets). White dashed lines delimitate the epithelium-mesenchyme junction. Scale bars: 100 μm. (B) DiI fluorescence (red) in cultured pleurodont dental tissue slices, imaged every other day (d0–d14) over a two-week period following initial dye administration (d0). White dashed lines indicate the border between the erupted tooth and the DL. Scale bars: 500 μm. (C) H and E and PCNA IHC (PCNA; red staining) in paraffin sections from cultured tissue slices of pleurodont teeth. The OE region near the OE-DL junction of teeth was removed on one side of the jaw (removal), and the opposing, equivalent teeth were used as controls (control). Black arrows indicate disrupted DL and SDL tissues in the removal experiment after one week of culture. Dashed lines separate epithelium from mesenchyme. Scale bars: 100 μm. (D) Quantification of the proportion of PCNA-positive cells in both DL and SDL in one-week dental tissue cultures with intact (control) or removed (removal) OE, as described in (C). Red values indicate mean values, n = 4 per group (*, p-value<0.05).

