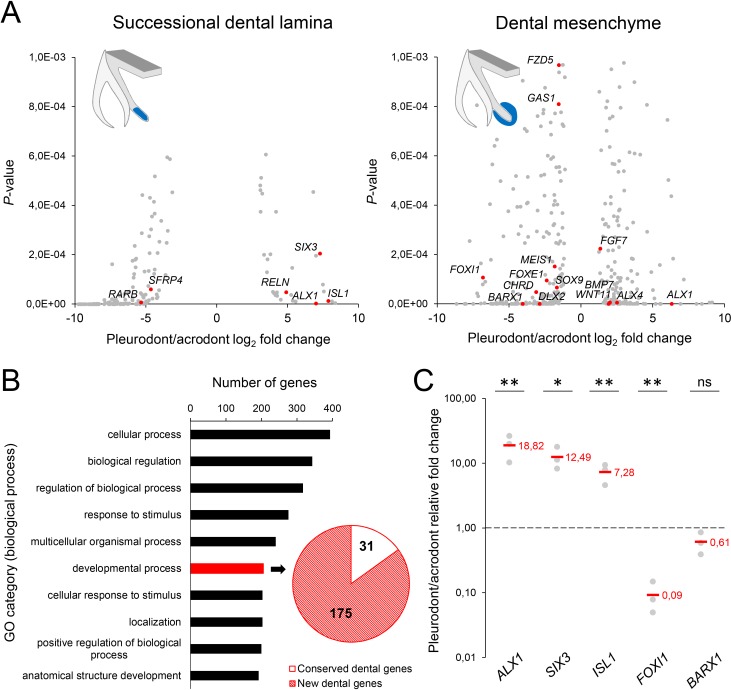
Figure 5. RNA sequencing of micro-dissected SDL and dental mesenchyme tissues reveals putative new genes involved in tooth replacement.
(A) Volcano plots of significantly differentially expressed genes (FDR-corrected p-values<0.05) between pleurodont and acrodont SDL (n = 206, left plot) and dental mesenchyme (n = 368, right) tissues at early postnatal stage (four dph), n = 3 per group. The x- and y-axes display the log2 fold change (pleurodont with respect to acrodont) and associated P-values, respectively. Positive log2 values indicate gene upregulation in pleurodont teeth, and red plot points highlight some key developmental genes and transcription factors (see main text). Schematic drawings illustrate the laser-microdissected areas (blue color) used for transcriptomics in each dental tissue type. (B) Gene ontology (GO) analysis of all differentially expressed genes between pleurodont and acrodont dental tissues (n = 574), as identified in (A). The ten top-ranking biological process categories by gene number are shown. The pie chart depicts the gene distribution from the category ‘developmental process’. Genes already known to be associated with vertebrate tooth development were defined as ‘conserved dental genes’ (white portion; n = 31), whereas other genes were categorized as ‘new dental genes’ (red shaded portion; n = 175). (C) Quantitative PCR of ALX1, SIX3, ISL1, FOXI1, and BARX1 in dental tissues from pleurodont and acrodont teeth. The x- and y-axes display the gene names and relative fold change (pleurodont with respect to acrodont), respectively. The dashed line depicts the position of a fold change of 1.00 (equal expression). Red values indicate mean values, n = 3 per gene (ns, non-significant; *, p-value<0.05; **, p-value<0.01).

