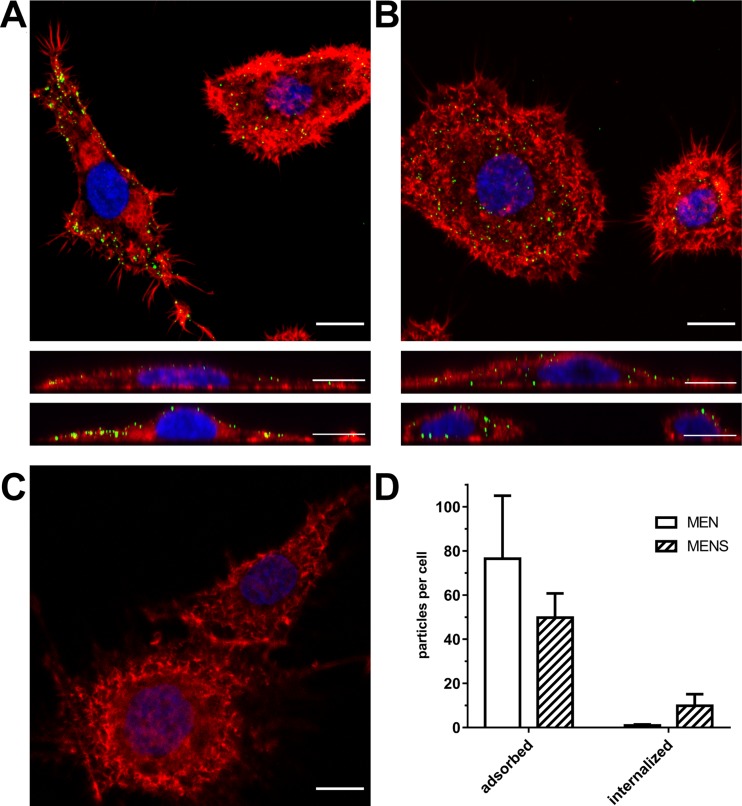
FIG 2.
MEN VLP and MENS VLP adhesion to and internalization in susceptible cells. (A to C) Confocal microscopy images of LLC-Mk2 cells incubated with purified MEN VLPs (A) and MENS VLPs (B) and mock-incubated control cells (C). The bottom lanes of panels A and B show the xz plane in orthogonal views. VLPs were detected with anti-M polyclonal serum and are immunostained in green, actin fibers were immunostained with phalloidin and are shown in red, and nuclei were immunostained with DAPI and are shown in blue. Bars = 10 μm. (D) Graph showing quantification of the adsorbed and internalized VLPs. Data are presented as means ± standard deviations (SD). Each bar shows data from a minimum of 24 106- by 106-μm fields of view, registered from three different samples.

