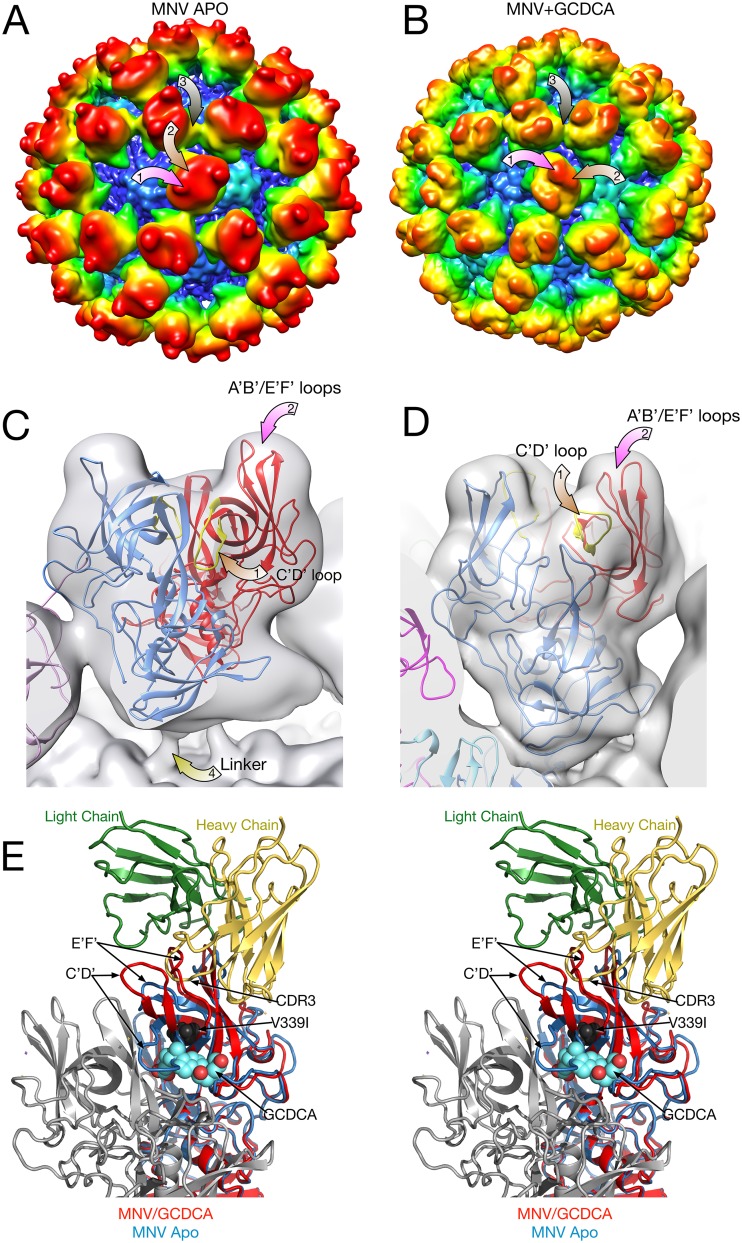
FIG 5.
Comparison of the P domains in the presence and absence of bile salts. For panels A to D, a 2-Å Gaussian filter was applied to the electron density maps so that they could be directly compared. (A and B) Surfaces of the apo and GCDCA forms of MNV, respectively, colored according to radial distances. The mauve arrows point to the locations of the A′B′/E′F′ loops and C′D′ loops, respectively. The brown arrow denotes the A/C subunit contact detailed in the stereo figure (panel E). Note the sharp protrusion in the apo form that is a ridge in the GCDCA-bound form. (C and D) Details of one of the P domain dimers. For panel C, the atomic model is the previously published apo structure (11), with the open and closed A′B′/E′F′ loop structures colored in blue and red, respectively. For panel D, the atomic model of the P domain/GCDCA complex is shown (21). (E) Stereo image of the comparison of the atomic structures of the P domain in the presence or absence of GCDCA and resulting differences in how a neutralizing antibody would bind. The heavy and light chains of bound 3D3 antibody (19) are shown in yellow and green, respectively. The bound GCDCA is represented by cyan and red spheres. The location of the 3D3 escape mutant, V339I, is represented by black spheres. The blue ribbon structure is of the “open” conformation of the apo P domain where that A′B′/E′F′ loops are splayed apart. In contrast, the red ribbon shows the conformation of the GCDCA-bound P domain (21) and how the loops in this conformation would likely prevent binding of the neutralizing antibody.

