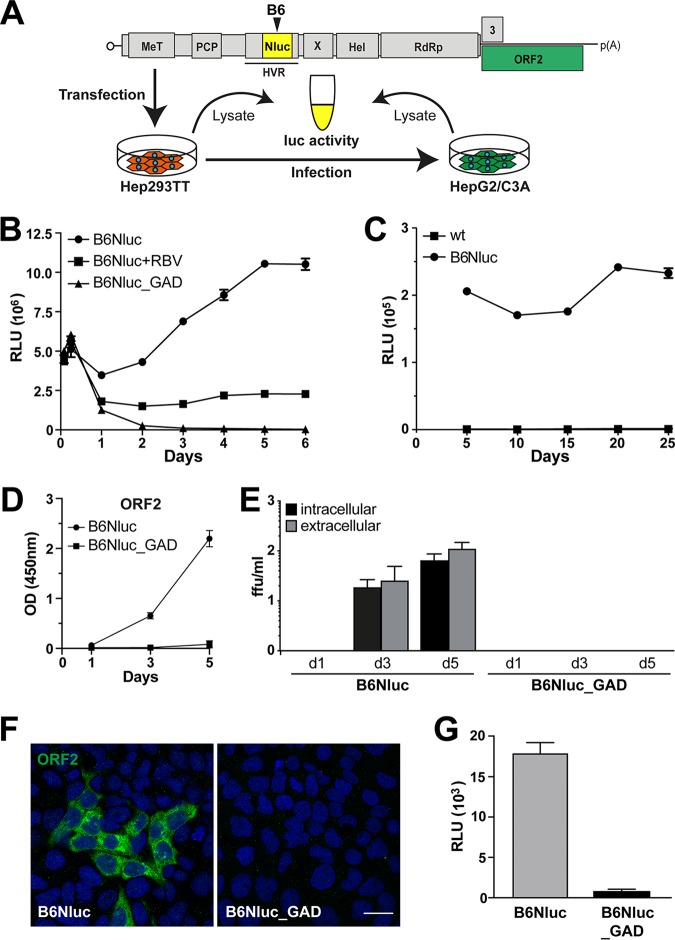
FIG 8.
HEV harboring a luciferase gene within ORF1 allows quantitative monitoring of viral replication. (A) Schematic representation of the HEV genome (see Fig. 1 legend for abbreviations) and of the experimental workflow. (B) Hep293TT cells were transfected with in vitro-transcribed RNA from full-length HEV 83-2-27 constructs with a NanoLuc insertion in ORF1 (B6Nluc). The antiviral activity of ribavirin (RBV) was evaluated at a concentration of 50 μM. A polymerase-defective mutant (B6Nluc_GAD) served as negative control. NanoLuc activity was measured at 2 and 6 h as well as at 1 to 6 days posttransfection. Mean relative light units (RLU) ± SD from triplicate experiments measured twice each are shown. (C) NanoLuc activity was measured in Hep293TT cells electroporated with parental (wild type [wt]) or B6Nluc full-length RNA over 25 days (5 passages). Each data point was obtained from 3 independent samples normalized to one million cells each. (D) HEV ORF2 protein release from Hep293TT cells electroporated with B6Nluc or B6Nluc_GAD full length RNA was measured by ELISA. The y axis represents the OD values at 450 nm after blank subtraction. Error bars represent means ± SD of results from triplicate measurements for each condition. (E) NanoLuc-tagged full-length HEV RNA produces infectious virus. Culture supernatants as well as cell lysates of Hep293TT cells electroporated with either B6Nluc or B6Nluc_GAD full-length RNA were collected at day 1 and day 3 as well as day 5 postelectroporation and used to infect naive HepG2/C3A cells, followed by determination of focus-forming units (ffu) to measure viral infectivity from intracellular or extracellular compartments as described in Materials and Methods. (F and G) Lysates from Hep293TT cells transfected with HEV83-2_B6Nluc or HEV83-2_B6Nluc_GAD RNA were used to infect naive HepG2/C3A cells. Infectivity was assessed by immunofluorescence 5 days postinfection using mouse MAb 1E6 against the ORF2 protein (F) or by luciferase assay (G). Cell nuclei were counterstained with DAPI (blue). The scale bar represents 20 μm. RLU levels were determined in triplicate 12-well plates measured twice each.

