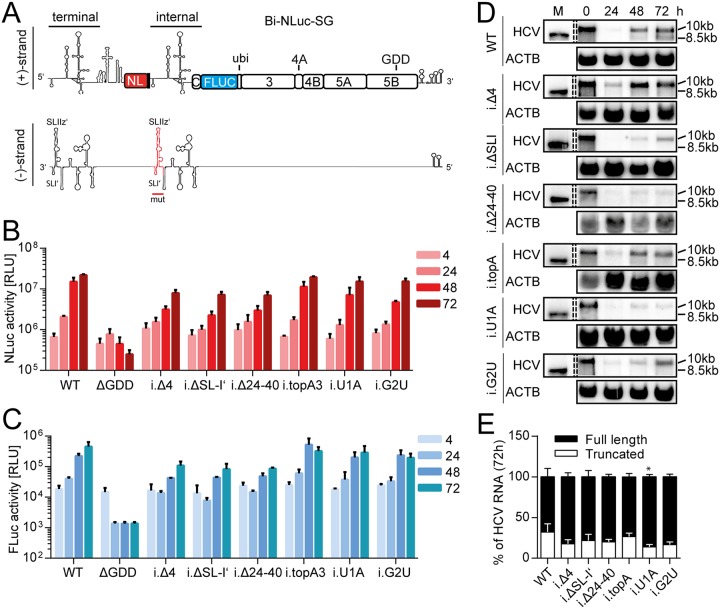
FIG 6.
Mutational analysis of the internal UTR. (A) Schematic of the Bi-NLuc-SG positive and negative strands. The internal 3′ UTR altered in the mutational analysis is indicated in red on the negative strand. (B and C) Measurement of Nano (red) and firefly (blue) luciferase activities of the mutants. (D) Northern blot analysis of total RNA extracted from transfected cells as in panels B and C at 0 to 72 h posttransfection, using a probe against HCV positive-strand RNA (HCV) or β-actin (ACTB). 10 kb, size of the full-length replicon; 8.5 kb, size of the truncated variant. (E) The ratios of full-length versus truncated RNAs were quantified. ΔGDD, replication-deficient NS5B mutant. Bars for luciferase activity represent the RLU without normalization (means ± the SD) of three biological replicates, each measured in technical duplicates. Northern blot analyses for quantification were performed three times for the WT and twice for each mutant. For a description of the mutations, refer to the legend of Fig. 3. The statistical significance of differences in truncated RNA generation was determined for each mutant against the WT. *, P < 0.05; **, P < 0.01; ***, P < 0.001.

