FIG 5.
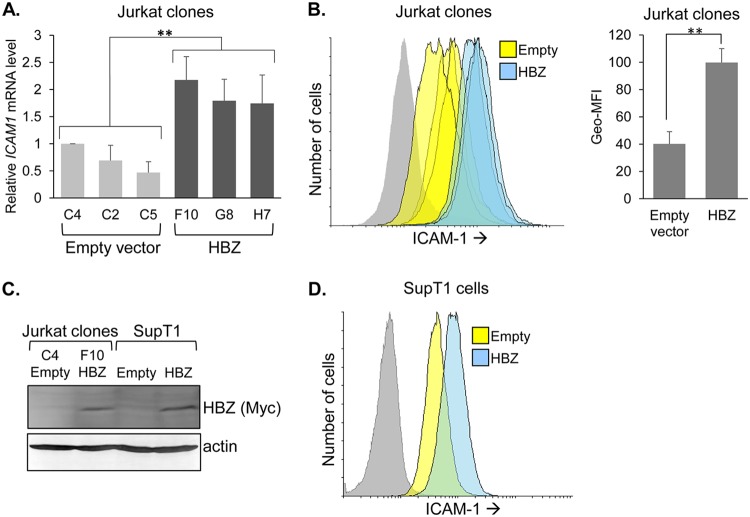
HBZ upregulates ICAM-1 expression. (A) ICAM1 mRNA levels in empty-vector and HBZ-expressing Jurkat clones. The graph shows qRT-PCR data averaged from seven independent experiments, with data normalized to values for empty-vector clone C4 (set to 1). Error bars show standard deviations. Significance was determined by a one-way ANOVA comparing the clones (P < 0.001), followed by a Tukey honestly significant difference (HSD) test; double asterisks denote a P value of <0.01 as the highest P value among pairwise comparisons between empty-vector and HBZ clones. (B) Flow cytometry analysis of ICAM-1 on empty-vector and HBZ-expressing Jurkat clonal cells. Histograms on the left show relative cell surface levels of ICAM-1 (empty-vector clones, yellow; HBZ-expressing clones, blue; secondary antibody probing clone F10, gray). The bar graph on the right shows the geometric mean fluorescence intensities (Geo-MFI) averaged for the three empty-vector clones versus the three HBZ-expressing clones. Data represent one of three independent experiments. Error bars show standard deviations. Significance was determined by a two-tailed Student's t test (**, P < 0.01). (C) Western blot analysis of whole-cell extracts prepared from SupT1 cells stably transduced with an HBZ expression vector or the empty vector and, for comparison, selected Jurkat clones. Membranes were probed with an antibody against Myc to detect the C-terminal epitope tag on HBZ and then stripped and probed for actin. (D) Flow cytometry analysis of ICAM-1 on empty-vector and HBZ-expressing SupT1 cells. Histograms show the relative cell surface levels of ICAM-1 (empty-vector cells, yellow; HBZ-expressing cells, blue; secondary antibody probing empty-vector cells, gray).

