FIG 9.
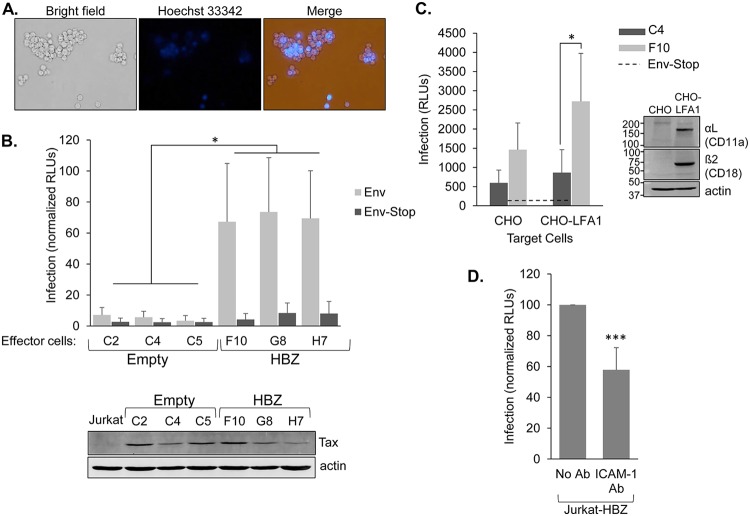
HBZ increases the infection efficiency of Jurkat cells when used as effector cells in infection assays. (A) Jurkat cells expressing HBZ form aggregates with HBZ-negative Jurkat cells. Jurkat cells stably expressing HBZ (6.7 × 10⁵ cells/ml) were stained with Hoechst 33342 and combined with an equal quantity of unstained normal Jurkat cells. Cellular aggregates were then completely disrupted, and cells were cocultured for 2 h and then photographed. (B) As effector cells, the HBZ-expressing Jurkat clones produce higher levels of infection than the empty-vector clones. Empty-vector and HBZ-expressing clones were cotransfected with pCMV-HT1Δenv, pCRU5H-inLuc, and either CMV-ENV (light bars) or CMV-ENVΔPvuII (dark bars) and cocultured with normal Jurkat cells. Luciferase assays were performed 48 h later. The graph shows infection as a measure of relative luminescence units (RLUs) normalized to the highest value in each experiment (set to 100). The effector cells used are indicated. Data were averaged from five independent experiments. Error bars show standard deviations. Significance was determined by a one-way ANOVA comparing the clones (P < 0.001), followed by a Tukey’s HSD test; an asterisk denotes a P value of <0.05 as the highest P value among pairwise comparisons between empty-vector and HBZ clones. The Western blot shows Tax expression in the indicated Jurkat clones cotransfected with pCMV-HT1Δenv, pCRU5H-inLuc, and CMV-ENV. The membrane was stripped and reprobed with an antibody against actin. (C) As effector cells, the Jurkat clones infect the intended target cells. HBZ-expressing cells (light bars; Jurkat clone F10) and empty-vector cells (dark bars; Jurkat clone C4) were transfected with pCMV-HT1Δenv, pCRU5H-inLuc, and either CMV-ENV or CMV-ENVΔPvuII and cocultured with normal CHO or CHO-LFA-1 cells for 1.5 to 2 h. Effector cells were then removed, and luciferase assays were performed on the CHO-LFA-1 cells 48 h later. The graph shows infection as a measure of relative luminescence units (RLUs) produced by the indicated effector cells with data averaged from five replicates per treatment from a single experiment. The graph is representative of three independent experiments. The horizontal dashed line shows the averaged background values (effector cells cotransfected with CMV-ENVΔPvuII). Error bars show standard deviations. Significance was determined by a two-tailed Student's t test (*, P < 0.05). The Western blot shows αL and β2 expression in CHO-LFA-1 cells. The membrane was probed for each LFA-1 subunit and actin. (D) Blocking ICAM-1 reduces the level of infection. HBZ-expressing Jurkat cells were cotransfected with pCMV-HT1Δenv, pCRU5H-inLuc, and CMV-ENV and cocultured with normal Jurkat cells in the absence or presence of an ICAM-1-blocking antibody. Luciferase assays were performed 48 h later. The graph shows data from five independent experiments, with infection shown as a measure of relative luminescence units (RLUs): luminescence from the antibody-treated coculture was normalized to luminescence from the untreated cocultures (set to 100) in each experiment. ***, P < 0.001 (for a two-tailed Student's t test).

